เพิ่มขึ้น
NASDAQ may break even higher than its Channel Up
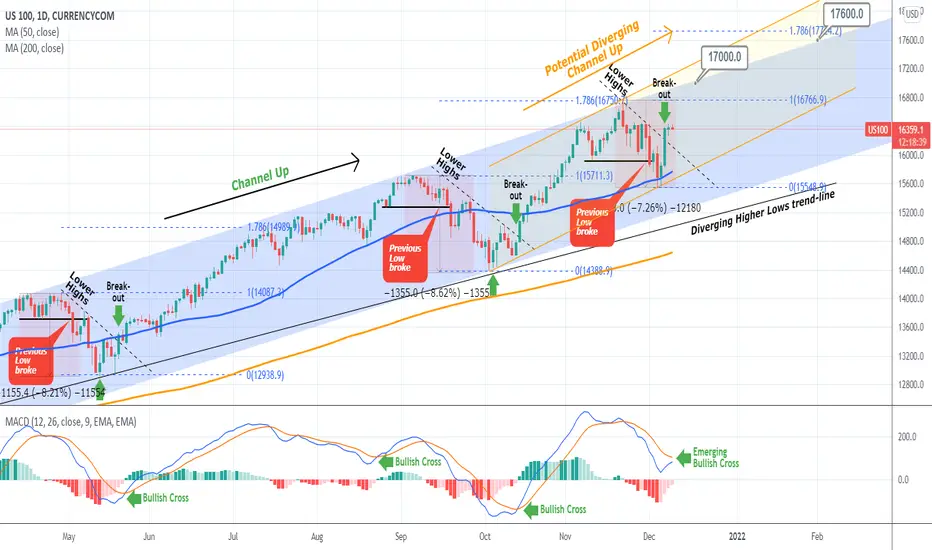
As mentioned on my previous analysis, the Lower High divergence on the 1D RSI was the signal that Nasdaq would pull-back. The small technical correction eventually ended at around -7% from the top, exactly on the 1D MA50 (blue trend-line). As I've mentioned before, this is generally considered a solid first buy entry.
The current chart shows that after a similar correction (8 to 8.50% roughly), NDX always starts a 2 month rise towards the 1.786 Fibonacci extension. The point of bullish break-out is typically when the 1D MACD forms a Bullish Cross, which is currently close to happening. Previously that has coincided with the break above the internal Lower Highs trend-line.
The 1.786 Fib extension is currently a little over 17700. If that takes place within the next 2 months, we may see the dominant 9-month Channel Up break upwards and transcend into the Diverging Channel Up displayed in orange. Regardless of that, our next two long-term targets are 17000 and 17600.
--------------------------------------------------------------------------------------------------------
** Please support this idea with your likes and comments, it is the best way to keep it relevant and support me. **
--------------------------------------------------------------------------------------------------------
👑Best Signals (Forex/Crypto+70% accuracy) & Account Management (+20% profit/month on 10k accounts)
💰Free Channel t.me/tradingshotglobal
🤵Contact info@tradingshot.com t.me/tradingshot
🔥New service: next X100 crypto GEMS!
💰Free Channel t.me/tradingshotglobal
🤵Contact info@tradingshot.com t.me/tradingshot
🔥New service: next X100 crypto GEMS!
คำจำกัดสิทธิ์ความรับผิดชอบ
ข้อมูลและบทความไม่ได้มีวัตถุประสงค์เพื่อก่อให้เกิดกิจกรรมทางการเงิน, การลงทุน, การซื้อขาย, ข้อเสนอแนะ หรือคำแนะนำประเภทอื่น ๆ ที่ให้หรือรับรองโดย TradingView อ่านเพิ่มเติมใน ข้อกำหนดการใช้งาน