ลดลง
NASDAQ August Analysis

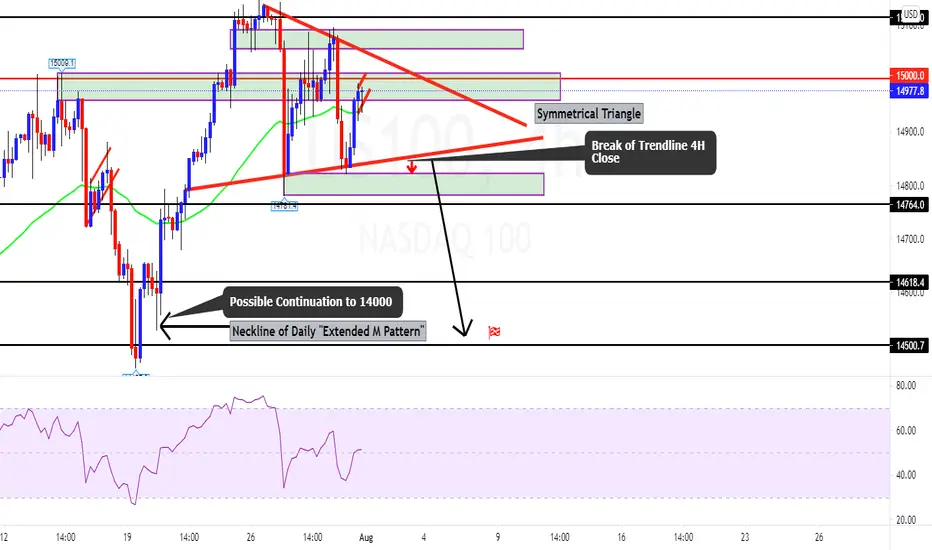
Daily bearish divergence. 4H symmetrical triangle. Currently rising flag pattern on 15 min inside the 4H zone indicating possible sell from zone. Once 4H closes below outside of triangle expecting price to go to 14500. That is neckline of the "Extended M Pattern". Since there is Daily bearish divergence it's possible for continuation from Daily "Extended M Pattern" neckline 14500 to 14000.
คำจำกัดสิทธิ์ความรับผิดชอบ
ข้อมูลและบทความไม่ได้มีวัตถุประสงค์เพื่อก่อให้เกิดกิจกรรมทางการเงิน, การลงทุน, การซื้อขาย, ข้อเสนอแนะ หรือคำแนะนำประเภทอื่น ๆ ที่ให้หรือรับรองโดย TradingView อ่านเพิ่มเติมที่ ข้อกำหนดการใช้งาน
คำจำกัดสิทธิ์ความรับผิดชอบ
ข้อมูลและบทความไม่ได้มีวัตถุประสงค์เพื่อก่อให้เกิดกิจกรรมทางการเงิน, การลงทุน, การซื้อขาย, ข้อเสนอแนะ หรือคำแนะนำประเภทอื่น ๆ ที่ให้หรือรับรองโดย TradingView อ่านเพิ่มเติมที่ ข้อกำหนดการใช้งาน