ULTRACEMCO – Daily Chart Analysis
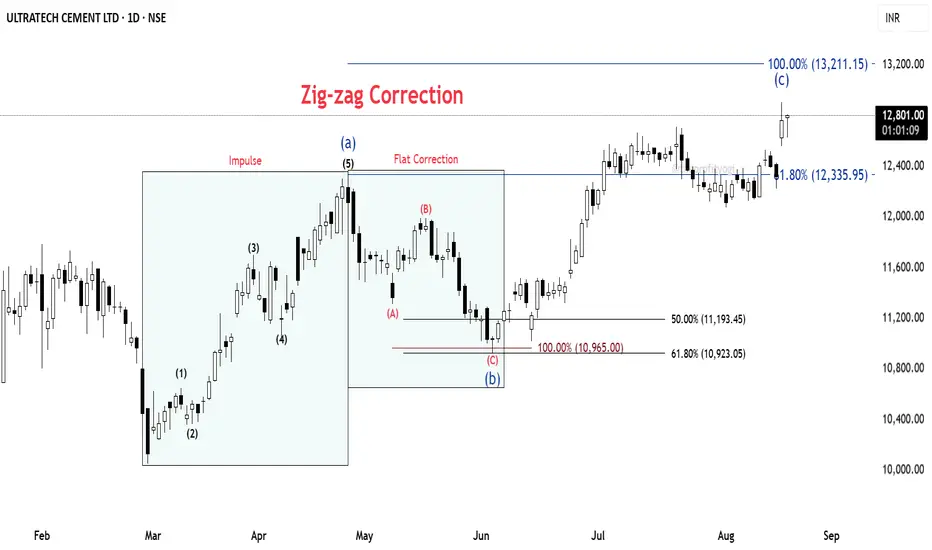
🔹 Base Point: The count begins from the low made on 3rd March 2025.
🔹 From this low, the price moved up in the form of a clear impulse wave, completing a 5-wave structure.
🔹 This was followed by a corrective fall, retracing 61.8% Fibonacci of the prior impulse.
⚡ Correction Phase:
The decline is counted as an ABC Flat correction (red).
Within this, the C wave extended fully to the 100% Fibonacci projection.
At this point, we observe a strong cluster zone formed by the 61.8% retracement and 100% extension, indicating confluence and potential support.
📈 Current Development:
From this support, the price has begun to move up again, showing the characteristics of a fresh impulse.
The overall structure fits into a larger Zig-Zag correction, where Wave C is still under development.⏳
📝 Summary:
✅ Impulse up (5 waves)
✅ Flat correction (A-B-C) complete at Fib cluster
🚀 Wave C of Zig-Zag unfolding
#ULTRACEMCO #NSEStocks #ElliottWave #Fibonacci #WaveAnalysis #TradingSetup #PriceAction
คำจำกัดสิทธิ์ความรับผิดชอบ
ข้อมูลและบทความไม่ได้มีวัตถุประสงค์เพื่อก่อให้เกิดกิจกรรมทางการเงิน, การลงทุน, การซื้อขาย, ข้อเสนอแนะ หรือคำแนะนำประเภทอื่น ๆ ที่ให้หรือรับรองโดย TradingView อ่านเพิ่มเติมใน ข้อกำหนดการใช้งาน
คำจำกัดสิทธิ์ความรับผิดชอบ
ข้อมูลและบทความไม่ได้มีวัตถุประสงค์เพื่อก่อให้เกิดกิจกรรมทางการเงิน, การลงทุน, การซื้อขาย, ข้อเสนอแนะ หรือคำแนะนำประเภทอื่น ๆ ที่ให้หรือรับรองโดย TradingView อ่านเพิ่มเติมใน ข้อกำหนดการใช้งาน