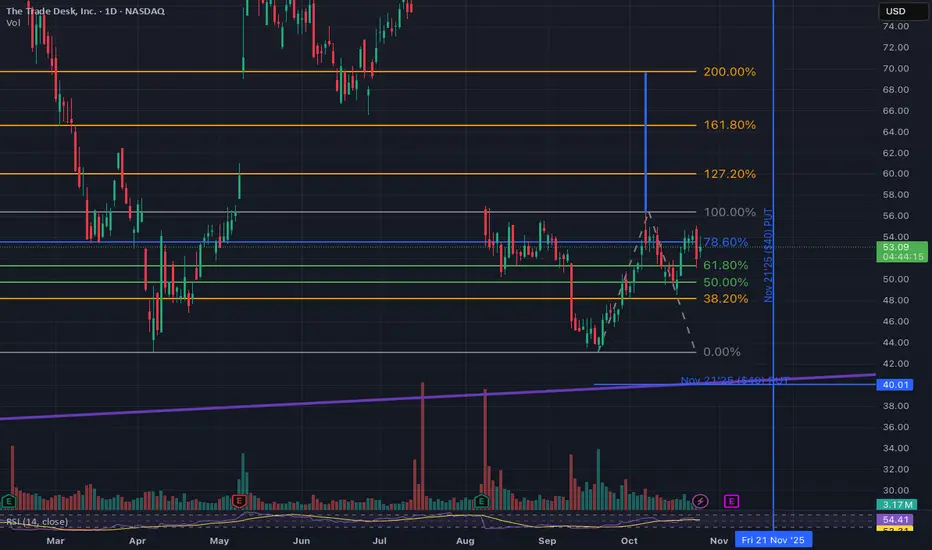
TTD has been forming a clear inverse head and shoulders pattern since its ER drop on 8th of August. If the pattern plays out TTD can reach around $70 where the 200% fib extension is.
If we zoom out we can see that it has a huge double bottom patter as well. ER on 6th of November may send it directly to $70.
It is possible to hedge the position with a 40$ strike PUT.
If we zoom out we can see that it has a huge double bottom patter as well. ER on 6th of November may send it directly to $70.
It is possible to hedge the position with a 40$ strike PUT.
คำจำกัดสิทธิ์ความรับผิดชอบ
ข้อมูลและบทความไม่ได้มีวัตถุประสงค์เพื่อก่อให้เกิดกิจกรรมทางการเงิน, การลงทุน, การซื้อขาย, ข้อเสนอแนะ หรือคำแนะนำประเภทอื่น ๆ ที่ให้หรือรับรองโดย TradingView อ่านเพิ่มเติมใน ข้อกำหนดการใช้งาน
คำจำกัดสิทธิ์ความรับผิดชอบ
ข้อมูลและบทความไม่ได้มีวัตถุประสงค์เพื่อก่อให้เกิดกิจกรรมทางการเงิน, การลงทุน, การซื้อขาย, ข้อเสนอแนะ หรือคำแนะนำประเภทอื่น ๆ ที่ให้หรือรับรองโดย TradingView อ่านเพิ่มเติมใน ข้อกำหนดการใช้งาน