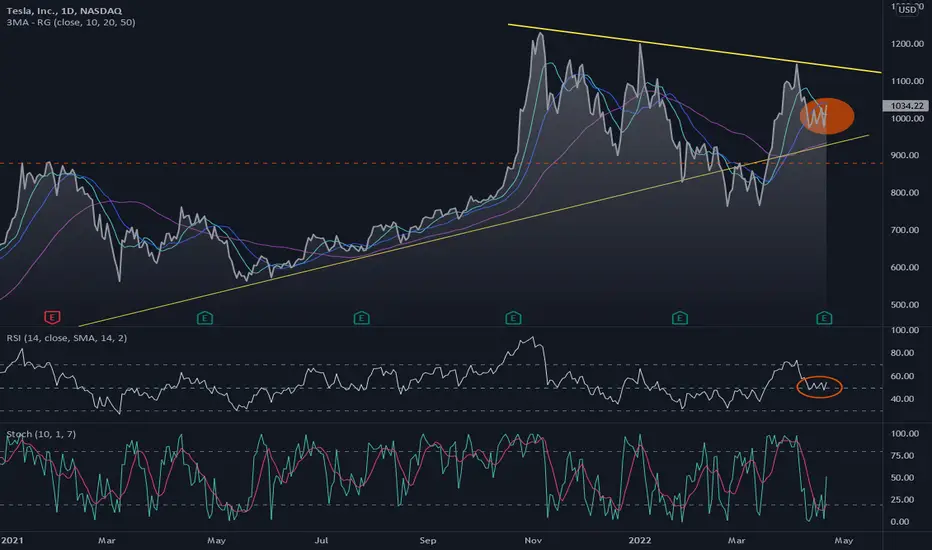
Sometimes I switch to a line graph so I can better evaluate price movements. Despite the high open, price is under the 20MA ~1042.
10MA is under 20, and the rally from 14 Mar up to the yellow line looks like the correction wave up. I see then the possibility of another move lower, but perhaps not yet. Note RSI at the 50 line and it needs to make a clear move lower. From TSLA's current price (1030-1040) there is the range below down to 980. Any real sell must get below 980 and then 930 and 880 (dashed orange line) become realistic targets.
The longer yellow line is from my weekly chart. I do not hold TSLA puts very long because of heavy theta decay; If I buy today near 1040 I will exit if price gets over 1043-1045.
I also see the potential for TSLA to move up again to the yellow line, or to vwap ~1060, and then begin a real descent lower. You will find good trades on this stock but never chase, stick to your levels, and be cautious with your capital.
การซื้อขายยังคงดำเนินอยู่
I missed my ideal entry when stock moved up to 1040, which was 200MA resistance on 30min chart. See four candles have rejected there and been stuck in a range between 1040-1030. I bought 29Apr puts to exit today or tomorrow but I will sell them if price does not break 1030 in next half hour.ปิดการเทรด ด้วยตนเอง
Yikes, fast dump from 1018 to 1011 just happened. I bought my 880 put, 29 Apr expiry, when stock was around 1034. 1015ish was my sell target based on 30min chart. The way markets are moving today, I am wondering if this daily candle will come all the way back to 980?คำจำกัดสิทธิ์ความรับผิดชอบ
ข้อมูลและบทความไม่ได้มีวัตถุประสงค์เพื่อก่อให้เกิดกิจกรรมทางการเงิน, การลงทุน, การซื้อขาย, ข้อเสนอแนะ หรือคำแนะนำประเภทอื่น ๆ ที่ให้หรือรับรองโดย TradingView อ่านเพิ่มเติมที่ ข้อกำหนดการใช้งาน
คำจำกัดสิทธิ์ความรับผิดชอบ
ข้อมูลและบทความไม่ได้มีวัตถุประสงค์เพื่อก่อให้เกิดกิจกรรมทางการเงิน, การลงทุน, การซื้อขาย, ข้อเสนอแนะ หรือคำแนะนำประเภทอื่น ๆ ที่ให้หรือรับรองโดย TradingView อ่านเพิ่มเติมที่ ข้อกำหนดการใช้งาน