🚀Intraday View (15-Min Chart)
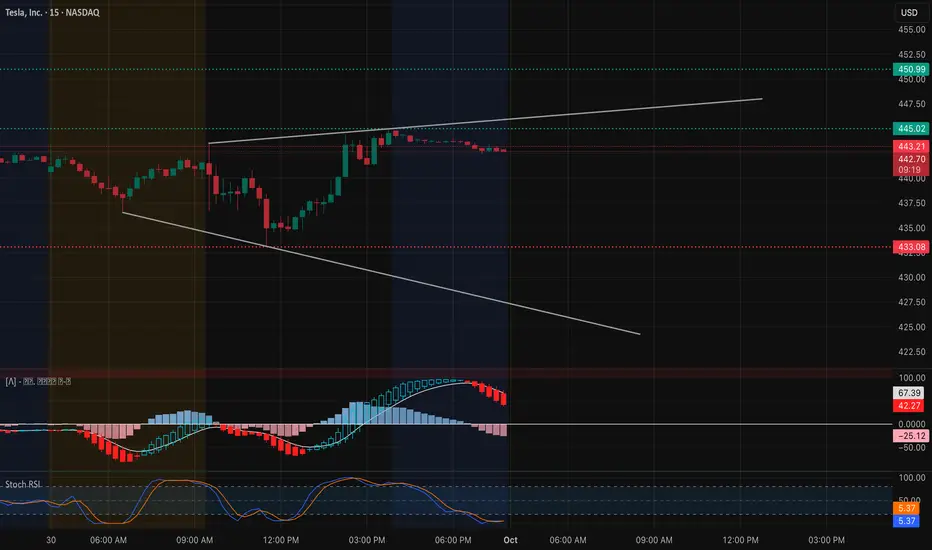
TSLA rebounded sharply intraday and is now consolidating around $443–$444 just under key resistance. Price action has formed a rising channel, but momentum is stalling.
* Support Levels: $442.20, $438.60, $433.08
* Resistance Levels: $445.00, $450.99, $452.50
* Indicators: MACD histogram rolling red, showing fading momentum. Stoch RSI sitting low, suggesting room for a relief bounce.
📌 Intraday Thought (Oct. 1): If $442 holds, expect attempts to push into $445–$450. A breakdown below $442 could trigger a move back toward $438 and $433. Scalpers can play long near $442 support with tight risk, or fade $450 resistance if tested and rejected.
Options & Swing View (1H + GEX)

Gamma exposure shows critical levels:
* Upside: Heavy call wall at $450–$452.5, with more stacked toward $465–$470.
* Downside: Strong put support near $432–$425, deeper wall at $417.5.
This suggests TSLA is coiling between $432–$450. A breakout over $450 could ignite momentum into $465–$470, while losing $432 risks a slide back to $425.
* Bullish Play (Oct. 1): Calls or debit spreads targeting $450 → $465 if price breaks $445 with volume.
* Bearish Hedge: Puts toward $432 → $425 if $442 breaks down.
* Neutral Play: Iron condor between $432–$452 to capture premium during consolidation.
My Thoughts (Oct. 1)
TSLA is parked right below a heavy $450 gamma wall. If bulls clear $445 and sustain, we could see an explosive push toward $465+. But failure to hold $442 opens the door to retesting $432 quickly. For now, this is a make-or-break level, and I’d keep risk management tight with options plays centered around the $450 breakout.
Disclaimer: This analysis is for educational purposes only and does not constitute financial advice. Always do your own research and manage risk before trading.
TSLA rebounded sharply intraday and is now consolidating around $443–$444 just under key resistance. Price action has formed a rising channel, but momentum is stalling.
* Support Levels: $442.20, $438.60, $433.08
* Resistance Levels: $445.00, $450.99, $452.50
* Indicators: MACD histogram rolling red, showing fading momentum. Stoch RSI sitting low, suggesting room for a relief bounce.
📌 Intraday Thought (Oct. 1): If $442 holds, expect attempts to push into $445–$450. A breakdown below $442 could trigger a move back toward $438 and $433. Scalpers can play long near $442 support with tight risk, or fade $450 resistance if tested and rejected.
Options & Swing View (1H + GEX)
Gamma exposure shows critical levels:
* Upside: Heavy call wall at $450–$452.5, with more stacked toward $465–$470.
* Downside: Strong put support near $432–$425, deeper wall at $417.5.
This suggests TSLA is coiling between $432–$450. A breakout over $450 could ignite momentum into $465–$470, while losing $432 risks a slide back to $425.
* Bullish Play (Oct. 1): Calls or debit spreads targeting $450 → $465 if price breaks $445 with volume.
* Bearish Hedge: Puts toward $432 → $425 if $442 breaks down.
* Neutral Play: Iron condor between $432–$452 to capture premium during consolidation.
My Thoughts (Oct. 1)
TSLA is parked right below a heavy $450 gamma wall. If bulls clear $445 and sustain, we could see an explosive push toward $465+. But failure to hold $442 opens the door to retesting $432 quickly. For now, this is a make-or-break level, and I’d keep risk management tight with options plays centered around the $450 breakout.
Disclaimer: This analysis is for educational purposes only and does not constitute financial advice. Always do your own research and manage risk before trading.
คำจำกัดสิทธิ์ความรับผิดชอบ
ข้อมูลและบทความไม่ได้มีวัตถุประสงค์เพื่อก่อให้เกิดกิจกรรมทางการเงิน, การลงทุน, การซื้อขาย, ข้อเสนอแนะ หรือคำแนะนำประเภทอื่น ๆ ที่ให้หรือรับรองโดย TradingView อ่านเพิ่มเติมที่ ข้อกำหนดการใช้งาน
คำจำกัดสิทธิ์ความรับผิดชอบ
ข้อมูลและบทความไม่ได้มีวัตถุประสงค์เพื่อก่อให้เกิดกิจกรรมทางการเงิน, การลงทุน, การซื้อขาย, ข้อเสนอแนะ หรือคำแนะนำประเภทอื่น ๆ ที่ให้หรือรับรองโดย TradingView อ่านเพิ่มเติมที่ ข้อกำหนดการใช้งาน