⚡Market Structure & Price Action:
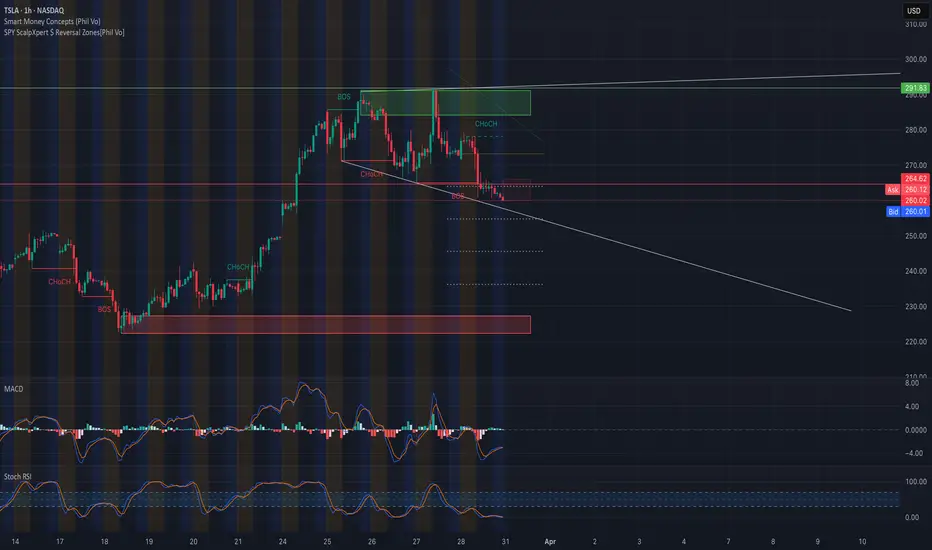
TSLA has shown a breakdown from its recent consolidation following a Break of Structure (BOS) and two Change of Character (CHoCH) signals. Price is now compressing downward in a falling wedge toward a key support zone around $260, suggesting a potential reversal or continuation setup.
* Bearish order block from the $290–$300 zone remains unchallenged.
* Current price action is hovering right at a support level with small-bodied candles, indicating indecision.
GEX & Options Flow Insights:

* IVR: 37.8
* IVx avg: 22.6
* Put Positioning: 71% (very defensive positioning by institutions)
* GEX: 🔴🔴🔴 (Strong bearish gamma exposure)
🧨 Highest negative GEX zone and Put support are stacking around $554–$550, acting as a gamma magnet and potential short-term floor if selling pressure accelerates.
Key Levels to Watch:
* Support Zones:
* $260.01 (current bid zone)
* $249.89
* $230 (lower wedge support)
* Resistance Zones:
* $275 (gap fill resistance)
* $291.83 (strong supply + BOS origin)
* $304.50 (major swing resistance)
Indicator Insights:
* MACD: Bullish crossover forming but lacking strong momentum
* Stoch RSI: Oversold territory, curling upward, hinting a potential short-term bounce
* Volume: Increasing on red candles, showing heavy sell pressure dominance recently
Scenarios:
🔼 Bullish Play:
* Entry: Above $264.50
* Target 1: $275
* Target 2: $291
* Stop-loss: Below $255 Confirmation needed via bullish CHoCH and break above descending wedge.
🔽 Bearish Play:
* Entry: Below $258 breakdown of wedge
* Target 1: $249
* Target 2: $230
* Stop-loss: Above $267 Watch for continuation if macro weakness persists and options flow remains bearish.
GEX Outlook Summary:
TSLA is entering a low-liquidity pocket with strong bearish gamma exposure. High IVR and heavy put concentration suggest institutional hedging, increasing the chance of a further breakdown unless buyers show up at key reversal zones.
Conclusion:
TSLA is at a make-or-break zone. If bulls can reclaim $265+, we may see a relief bounce. However, bearish options pressure and gamma positioning suggest the path of least resistance could still be down, especially toward $250.
Disclaimer: This analysis is for educational purposes only and does not constitute financial advice. Always do your own research and manage risk wisely.
TSLA has shown a breakdown from its recent consolidation following a Break of Structure (BOS) and two Change of Character (CHoCH) signals. Price is now compressing downward in a falling wedge toward a key support zone around $260, suggesting a potential reversal or continuation setup.
* Bearish order block from the $290–$300 zone remains unchallenged.
* Current price action is hovering right at a support level with small-bodied candles, indicating indecision.
GEX & Options Flow Insights:
* IVR: 37.8
* IVx avg: 22.6
* Put Positioning: 71% (very defensive positioning by institutions)
* GEX: 🔴🔴🔴 (Strong bearish gamma exposure)
🧨 Highest negative GEX zone and Put support are stacking around $554–$550, acting as a gamma magnet and potential short-term floor if selling pressure accelerates.
Key Levels to Watch:
* Support Zones:
* $260.01 (current bid zone)
* $249.89
* $230 (lower wedge support)
* Resistance Zones:
* $275 (gap fill resistance)
* $291.83 (strong supply + BOS origin)
* $304.50 (major swing resistance)
Indicator Insights:
* MACD: Bullish crossover forming but lacking strong momentum
* Stoch RSI: Oversold territory, curling upward, hinting a potential short-term bounce
* Volume: Increasing on red candles, showing heavy sell pressure dominance recently
Scenarios:
🔼 Bullish Play:
* Entry: Above $264.50
* Target 1: $275
* Target 2: $291
* Stop-loss: Below $255 Confirmation needed via bullish CHoCH and break above descending wedge.
🔽 Bearish Play:
* Entry: Below $258 breakdown of wedge
* Target 1: $249
* Target 2: $230
* Stop-loss: Above $267 Watch for continuation if macro weakness persists and options flow remains bearish.
GEX Outlook Summary:
TSLA is entering a low-liquidity pocket with strong bearish gamma exposure. High IVR and heavy put concentration suggest institutional hedging, increasing the chance of a further breakdown unless buyers show up at key reversal zones.
Conclusion:
TSLA is at a make-or-break zone. If bulls can reclaim $265+, we may see a relief bounce. However, bearish options pressure and gamma positioning suggest the path of least resistance could still be down, especially toward $250.
Disclaimer: This analysis is for educational purposes only and does not constitute financial advice. Always do your own research and manage risk wisely.
คำจำกัดสิทธิ์ความรับผิดชอบ
ข้อมูลและบทความไม่ได้มีวัตถุประสงค์เพื่อก่อให้เกิดกิจกรรมทางการเงิน, การลงทุน, การซื้อขาย, ข้อเสนอแนะ หรือคำแนะนำประเภทอื่น ๆ ที่ให้หรือรับรองโดย TradingView อ่านเพิ่มเติมใน ข้อกำหนดการใช้งาน
คำจำกัดสิทธิ์ความรับผิดชอบ
ข้อมูลและบทความไม่ได้มีวัตถุประสงค์เพื่อก่อให้เกิดกิจกรรมทางการเงิน, การลงทุน, การซื้อขาย, ข้อเสนอแนะ หรือคำแนะนำประเภทอื่น ๆ ที่ให้หรือรับรองโดย TradingView อ่านเพิ่มเติมใน ข้อกำหนดการใช้งาน