📊 What Are Bollinger Bands?
Bollinger Bands are a popular technical analysis tool developed by John Bollinger. They help traders identify volatility and potential price movements in the stock, crypto, or forex markets. 📈📉
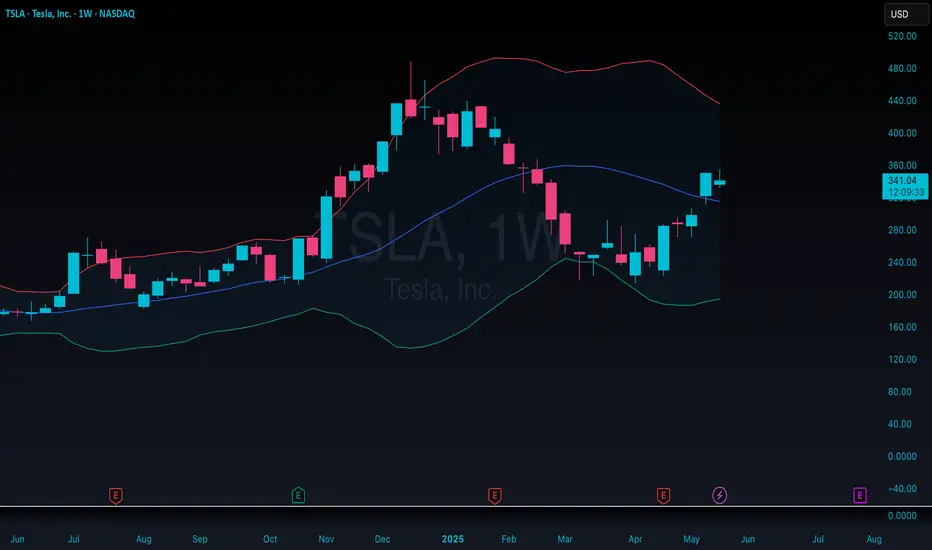
They consist of three lines:
🔹 Middle Band: A simple moving average (SMA), usually over 20 periods.
🔼 Upper Band: SMA + 2 standard deviations.
🔽 Lower Band: SMA - 2 standard deviations.
🛠️ How Do Bollinger Bands Work?
The bands expand and contract based on market volatility:
📈 When the market is volatile, the bands widen.
📉 When the market is calm, the bands narrow.
This tells traders whether the price is likely to break out or revert to the mean.
📌 How Are They Used?
✅ 1. Identifying Overbought/Oversold Conditions
If the price touches or goes above the upper band 🔼, it may be overbought (potential to sell).
If the price hits or goes below the lower band 🔽, it may be oversold (potential to buy).
🔁 2. Mean Reversion Strategy
Prices often return to the middle band (SMA) ➡️ after touching either the upper or lower band.
This is called a reversion to the mean strategy.
💥 3. Breakout Signals
Bollinger Band Squeeze: When the bands contract tightly, it usually signals a big move coming soon — but it doesn't say in which direction.
Traders look for breakouts after the squeeze to catch a new trend.
⚠️ Pro Tips
❌ Don't use Bollinger Bands alone — combine them with other indicators like RSI or MACD for better accuracy.
⏱️ Timeframe matters! They behave differently on a 5-minute chart than a daily chart.
📚 Practice in a demo account before using real money.
🧠 In Summary
Bollinger Bands help you:
Spot trends 🧭
Identify volatility 🌪️
Time entries & exits 📅
They're a powerful ally in any trader’s toolbox — just remember: no indicator is 100% accurate! 🎯
Bollinger Bands are a popular technical analysis tool developed by John Bollinger. They help traders identify volatility and potential price movements in the stock, crypto, or forex markets. 📈📉
They consist of three lines:
🔹 Middle Band: A simple moving average (SMA), usually over 20 periods.
🔼 Upper Band: SMA + 2 standard deviations.
🔽 Lower Band: SMA - 2 standard deviations.
🛠️ How Do Bollinger Bands Work?
The bands expand and contract based on market volatility:
📈 When the market is volatile, the bands widen.
📉 When the market is calm, the bands narrow.
This tells traders whether the price is likely to break out or revert to the mean.
📌 How Are They Used?
✅ 1. Identifying Overbought/Oversold Conditions
If the price touches or goes above the upper band 🔼, it may be overbought (potential to sell).
If the price hits or goes below the lower band 🔽, it may be oversold (potential to buy).
🔁 2. Mean Reversion Strategy
Prices often return to the middle band (SMA) ➡️ after touching either the upper or lower band.
This is called a reversion to the mean strategy.
💥 3. Breakout Signals
Bollinger Band Squeeze: When the bands contract tightly, it usually signals a big move coming soon — but it doesn't say in which direction.
Traders look for breakouts after the squeeze to catch a new trend.
⚠️ Pro Tips
❌ Don't use Bollinger Bands alone — combine them with other indicators like RSI or MACD for better accuracy.
⏱️ Timeframe matters! They behave differently on a 5-minute chart than a daily chart.
📚 Practice in a demo account before using real money.
🧠 In Summary
Bollinger Bands help you:
Spot trends 🧭
Identify volatility 🌪️
Time entries & exits 📅
They're a powerful ally in any trader’s toolbox — just remember: no indicator is 100% accurate! 🎯
20+ years in global markets — from the London Stock Exchange to the New York Stock Exchange — mastering Europe’s pulse and Wall Street’s edge.
คำจำกัดสิทธิ์ความรับผิดชอบ
ข้อมูลและบทความไม่ได้มีวัตถุประสงค์เพื่อก่อให้เกิดกิจกรรมทางการเงิน, การลงทุน, การซื้อขาย, ข้อเสนอแนะ หรือคำแนะนำประเภทอื่น ๆ ที่ให้หรือรับรองโดย TradingView อ่านเพิ่มเติมที่ ข้อกำหนดการใช้งาน