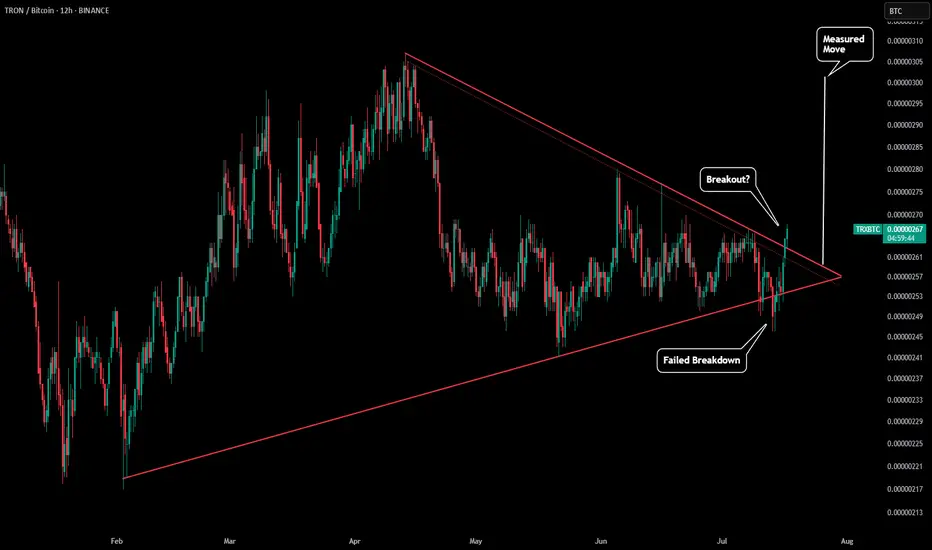
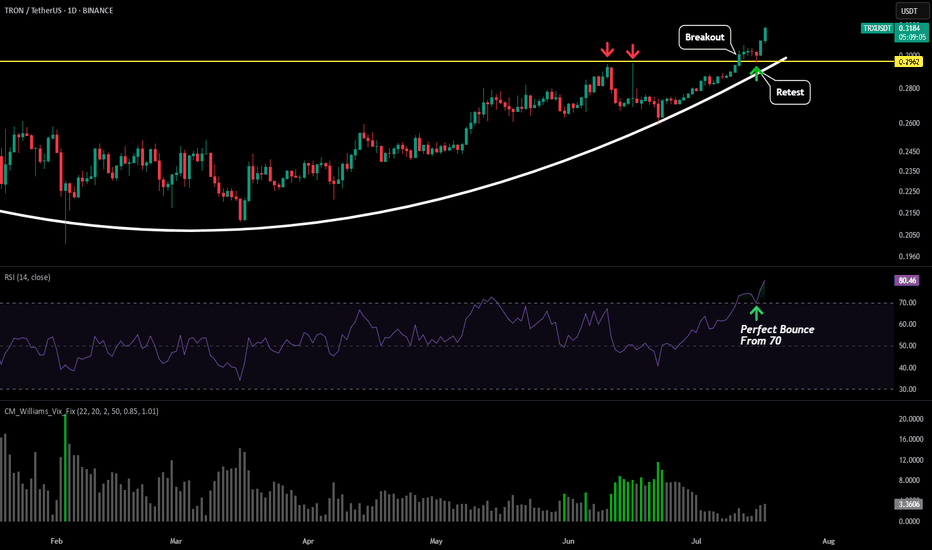
We have already seen the TRX/USD chart breakout (as seen in our previous post), but now the BTC pair is trying to breakout to.
On the daily chart we are trying to get above our downwards sloping red resistance line. It is possible we retest, but if this breakout continue that could push the BTC pair to above $0.000003 +. This is inline with our measured move (white line) and also where the symmetrical triangle started.
On the daily chart we are trying to get above our downwards sloping red resistance line. It is possible we retest, but if this breakout continue that could push the BTC pair to above $0.000003 +. This is inline with our measured move (white line) and also where the symmetrical triangle started.
คำจำกัดสิทธิ์ความรับผิดชอบ
ข้อมูลและบทความไม่ได้มีวัตถุประสงค์เพื่อก่อให้เกิดกิจกรรมทางการเงิน, การลงทุน, การซื้อขาย, ข้อเสนอแนะ หรือคำแนะนำประเภทอื่น ๆ ที่ให้หรือรับรองโดย TradingView อ่านเพิ่มเติมที่ ข้อกำหนดการใช้งาน
คำจำกัดสิทธิ์ความรับผิดชอบ
ข้อมูลและบทความไม่ได้มีวัตถุประสงค์เพื่อก่อให้เกิดกิจกรรมทางการเงิน, การลงทุน, การซื้อขาย, ข้อเสนอแนะ หรือคำแนะนำประเภทอื่น ๆ ที่ให้หรือรับรองโดย TradingView อ่านเพิ่มเติมที่ ข้อกำหนดการใช้งาน