Tatva Chintan – Major Trendline #Breakout After Long Downtrend 📈🔥
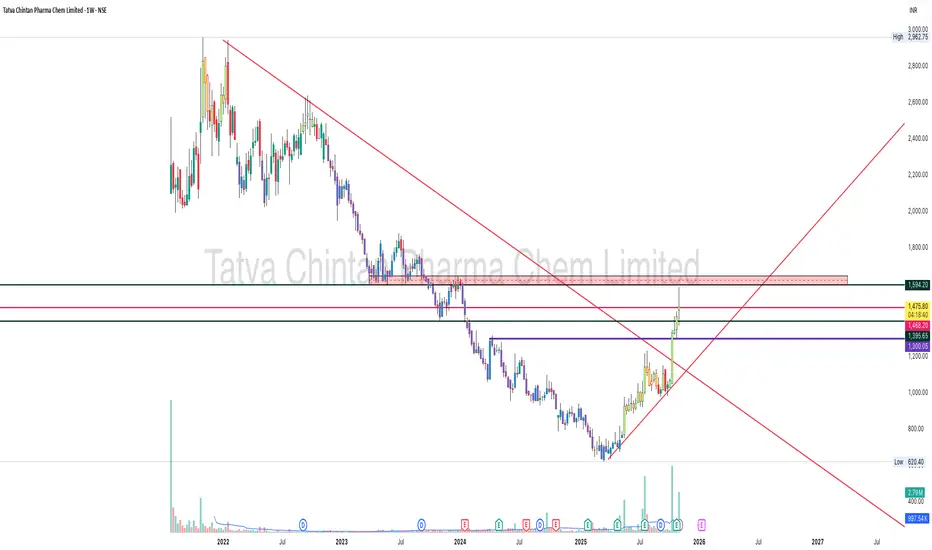
Tatva Chintan Pharma has broken a multi-year falling trendline, ending a prolonged downtrend phase since 2021.
This breakout is backed by strong price momentum + volume expansion, indicating accumulation and potential reversal into a long-term uptrend.
📌 Breakout Zone: ~₹1350 – ₹1400
📌 Current Price: ~₹1467
📌 Structure: Breakout + retest + continuation
📌 Momentum: Trading above 50 & 200 EMA on weekly 👌
Key Levels
Immediate Resistance:
Support Zones
As long as price sustains above ₹1310-1340 range, bullish structure remains intact ✅
Why This Breakout Matters
✅ Multi-year trendline breach
✅ Higher-lows forming since 2024 bottom
✅ Strong accumulation volume
✅ Pharma sector strength visible
✅ Potential trend reversal from long accumulation base
This kind of pattern often leads to multi-month swing opportunities if trend sustains.
View
Bias remains bullish until structure breaks.
Watching for follow-through above ₹1500 zone for extended upside.
📒 Educational chart analysis — not investment advice.
Tatva Chintan Pharma has broken a multi-year falling trendline, ending a prolonged downtrend phase since 2021.
This breakout is backed by strong price momentum + volume expansion, indicating accumulation and potential reversal into a long-term uptrend.
📌 Breakout Zone: ~₹1350 – ₹1400
📌 Current Price: ~₹1467
📌 Structure: Breakout + retest + continuation
📌 Momentum: Trading above 50 & 200 EMA on weekly 👌
Key Levels
Immediate Resistance:
- ₹1468 (current zone)
- ₹1594
Support Zones
- ₹1395
- ₹1343
- ₹1311 (major retest zone)
As long as price sustains above ₹1310-1340 range, bullish structure remains intact ✅
Why This Breakout Matters
✅ Multi-year trendline breach
✅ Higher-lows forming since 2024 bottom
✅ Strong accumulation volume
✅ Pharma sector strength visible
✅ Potential trend reversal from long accumulation base
This kind of pattern often leads to multi-month swing opportunities if trend sustains.
View
Bias remains bullish until structure breaks.
Watching for follow-through above ₹1500 zone for extended upside.
📒 Educational chart analysis — not investment advice.
คำจำกัดสิทธิ์ความรับผิดชอบ
ข้อมูลและบทความไม่ได้มีวัตถุประสงค์เพื่อก่อให้เกิดกิจกรรมทางการเงิน, การลงทุน, การซื้อขาย, ข้อเสนอแนะ หรือคำแนะนำประเภทอื่น ๆ ที่ให้หรือรับรองโดย TradingView อ่านเพิ่มเติมที่ ข้อกำหนดการใช้งาน
คำจำกัดสิทธิ์ความรับผิดชอบ
ข้อมูลและบทความไม่ได้มีวัตถุประสงค์เพื่อก่อให้เกิดกิจกรรมทางการเงิน, การลงทุน, การซื้อขาย, ข้อเสนอแนะ หรือคำแนะนำประเภทอื่น ๆ ที่ให้หรือรับรองโดย TradingView อ่านเพิ่มเติมที่ ข้อกำหนดการใช้งาน