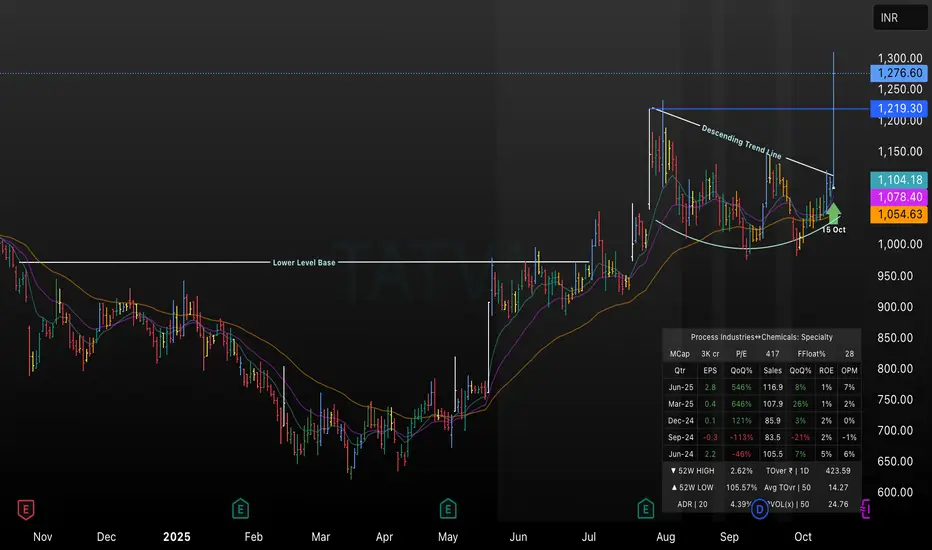
This TradingView chart highlights Tatva’s price action as it breaks above a descending trend line on October 15, 2025, signaling a strong bullish move. Key levels such as the lower base, breakout zone, and price targets (₹1219.30, ₹1276.60, ₹1300.00) are marked, with EMA indicators supporting positive momentum. The chart includes recent fundamentals, making it ideal for technical traders analyzing breakout setups and trend reversals in specialty chemicals stocks for Q4 2025
คำจำกัดสิทธิ์ความรับผิดชอบ
ข้อมูลและบทความไม่ได้มีวัตถุประสงค์เพื่อก่อให้เกิดกิจกรรมทางการเงิน, การลงทุน, การซื้อขาย, ข้อเสนอแนะ หรือคำแนะนำประเภทอื่น ๆ ที่ให้หรือรับรองโดย TradingView อ่านเพิ่มเติมที่ ข้อกำหนดการใช้งาน
คำจำกัดสิทธิ์ความรับผิดชอบ
ข้อมูลและบทความไม่ได้มีวัตถุประสงค์เพื่อก่อให้เกิดกิจกรรมทางการเงิน, การลงทุน, การซื้อขาย, ข้อเสนอแนะ หรือคำแนะนำประเภทอื่น ๆ ที่ให้หรือรับรองโดย TradingView อ่านเพิ่มเติมที่ ข้อกำหนดการใช้งาน