3. Tata Technologies Ltd
- Analysis:
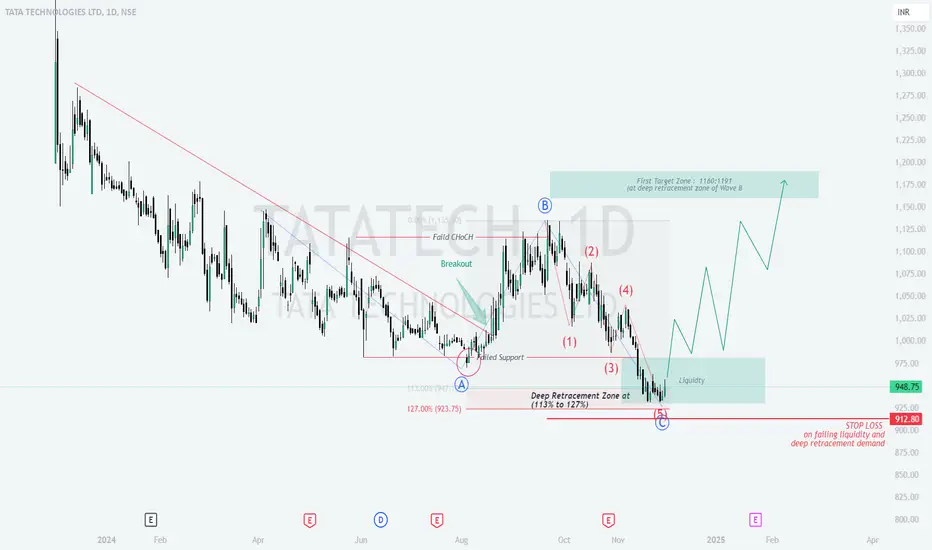
Wave Structure: A 5-wave corrective structure with Wave C reaching a deep retracement zone (113%-127% of Wave A).
Liquidity Zone: Indicates possible institutional accumulation near current levels.
Target Zone: Marked at 1160-1191 INR, aligning with Wave B retracement levels.
Stop Loss: Placed at 912.80 INR, just below the support zone. - Trading Plan:
Action: Initiate buy positions at current levels (948.75 INR) or near the 923-912 zone if prices dip.
Stop Loss: Place at 912.80 INR.
Targets:
First Target: 1160 INR.
Final Target: 1191 INR. - Reasoning:
Confluence of support in the retracement zone suggests potential for reversal.
Target aligns with historical resistance, providing logical exit levels.
คำจำกัดสิทธิ์ความรับผิดชอบ
ข้อมูลและบทความไม่ได้มีวัตถุประสงค์เพื่อก่อให้เกิดกิจกรรมทางการเงิน, การลงทุน, การซื้อขาย, ข้อเสนอแนะ หรือคำแนะนำประเภทอื่น ๆ ที่ให้หรือรับรองโดย TradingView อ่านเพิ่มเติมใน ข้อกำหนดการใช้งาน
คำจำกัดสิทธิ์ความรับผิดชอบ
ข้อมูลและบทความไม่ได้มีวัตถุประสงค์เพื่อก่อให้เกิดกิจกรรมทางการเงิน, การลงทุน, การซื้อขาย, ข้อเสนอแนะ หรือคำแนะนำประเภทอื่น ๆ ที่ให้หรือรับรองโดย TradingView อ่านเพิ่มเติมใน ข้อกำหนดการใช้งาน