Key Intraday Metrics (Sep 3, 2025 – by mid-day)
Previous Close: ₹158.39
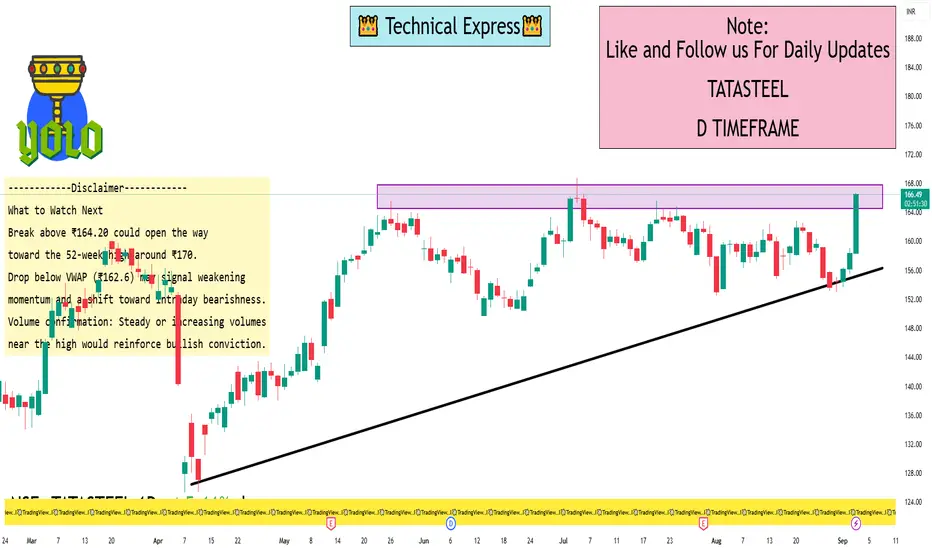
Today’s Trading Range: ₹158.40 (Low) to ₹164.20 (High)
Latest Price: Around ₹164.42, marking a gain of approximately +3.8% for the day
VWAP (Volume-Weighted Average Price): ₹162.61
Interpretation: One-Day Price Levels
Support Level: Around ₹158.40 — this represents the daily low, serving as a key intraday support.
Resistance Level: Around ₹164.20, just below the intraday high, acting as key intraday resistance.
VWAP (~₹162.6): This level is significant—price above VWAP indicates bullish pressure; below suggests bearish sentiment.
The stock is trading above both VWAP and the previous close, which is a sign of short-term bullishness.
Additional Context & Perspective
Short-Term Trend: According to TradingView’s technical indicators, the 1-day view shows a “strong buy”, and the 1-week view remains a “buy”
Momentum & Breadth: The 50-day and 20-day moving average crossovers suggest potential follow-through, with historical averages showing gains of ~5.6% within 30 days and ~3.7% within 7 days of such signals
52-Week Range: ₹122.62 (low) to ₹170.18 (high) — today’s high sits well within this broader context
Previous Close: ₹158.39
Today’s Trading Range: ₹158.40 (Low) to ₹164.20 (High)
Latest Price: Around ₹164.42, marking a gain of approximately +3.8% for the day
VWAP (Volume-Weighted Average Price): ₹162.61
Interpretation: One-Day Price Levels
Support Level: Around ₹158.40 — this represents the daily low, serving as a key intraday support.
Resistance Level: Around ₹164.20, just below the intraday high, acting as key intraday resistance.
VWAP (~₹162.6): This level is significant—price above VWAP indicates bullish pressure; below suggests bearish sentiment.
The stock is trading above both VWAP and the previous close, which is a sign of short-term bullishness.
Additional Context & Perspective
Short-Term Trend: According to TradingView’s technical indicators, the 1-day view shows a “strong buy”, and the 1-week view remains a “buy”
Momentum & Breadth: The 50-day and 20-day moving average crossovers suggest potential follow-through, with historical averages showing gains of ~5.6% within 30 days and ~3.7% within 7 days of such signals
52-Week Range: ₹122.62 (low) to ₹170.18 (high) — today’s high sits well within this broader context
I built a Buy & Sell Signal Indicator with 85% accuracy.
📈 Get access via DM or
WhatsApp: wa.link/d997q0
Contact - +91 76782 40962
| Email: techncialexpress@gmail.com
| Script Coder | Trader | Investor | From India
📈 Get access via DM or
WhatsApp: wa.link/d997q0
Contact - +91 76782 40962
| Email: techncialexpress@gmail.com
| Script Coder | Trader | Investor | From India
การนำเสนอที่เกี่ยวข้อง
คำจำกัดสิทธิ์ความรับผิดชอบ
ข้อมูลและบทความไม่ได้มีวัตถุประสงค์เพื่อก่อให้เกิดกิจกรรมทางการเงิน, การลงทุน, การซื้อขาย, ข้อเสนอแนะ หรือคำแนะนำประเภทอื่น ๆ ที่ให้หรือรับรองโดย TradingView อ่านเพิ่มเติมใน ข้อกำหนดการใช้งาน