On the weekly we are seeing some expansion of the bollinger mass in 3dwave pm heat map indicator. CCI is high, wave-pm is indicating very high levels of compression on all lengths
On the daily wave-pm is showing compression. 3D Wave-pm heat map is showing strength in these bollingers for support for price.
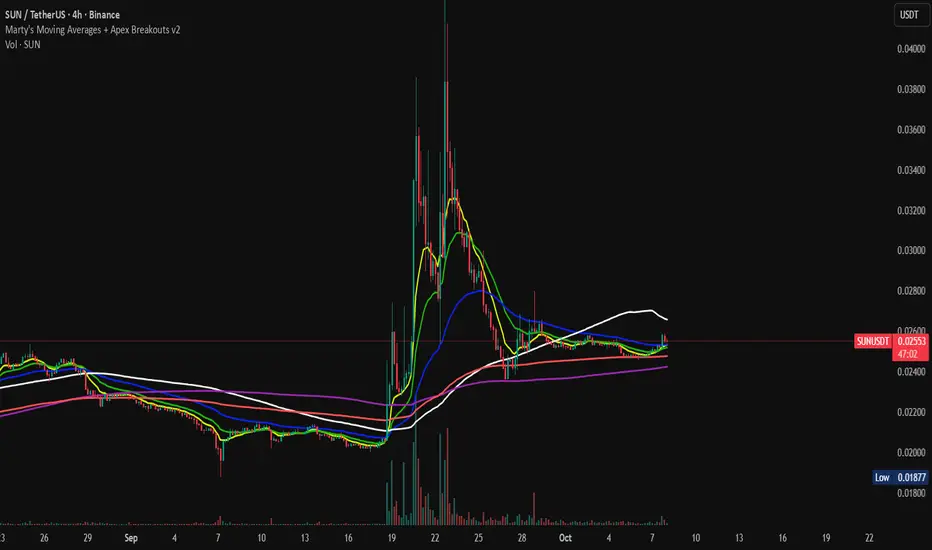
On the lower timeframe, 4hr we are seeing a range and massive compression on 3D Wave-PM indicated by all the blue. Within the green range we are seeing the micro beginnings of an expansion.
CryptoCheck Education / Buy & Sell Alerts
Trading Group 5 day FREE trial >>> discord.gg/jJG5EYA
More Info >>> thecryptocheck.com
Trading Group 5 day FREE trial >>> discord.gg/jJG5EYA
More Info >>> thecryptocheck.com
การนำเสนอที่เกี่ยวข้อง
คำจำกัดสิทธิ์ความรับผิดชอบ
ข้อมูลและบทความไม่ได้มีวัตถุประสงค์เพื่อก่อให้เกิดกิจกรรมทางการเงิน, การลงทุน, การซื้อขาย, ข้อเสนอแนะ หรือคำแนะนำประเภทอื่น ๆ ที่ให้หรือรับรองโดย TradingView อ่านเพิ่มเติมที่ ข้อกำหนดการใช้งาน