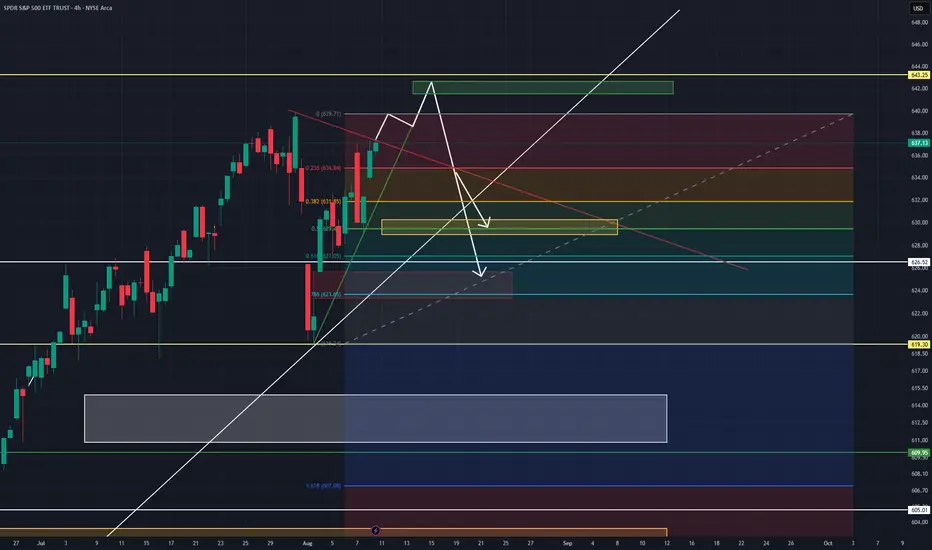
This week watching  SPY I am looking at the Spy's rsi on a few time frames wanting more bullishness but lacking the strength. Watching some data this week or any news- this might be the catalyst to achieve the clear want for more upside (642-645) before any further flush. I see us, in this bullish case, to touch highs again and possibly test it or go a bit higher before playing out the bearish divergence and weakness that has been showing on the Adx, rsi, and price action (candles) over the last 2 weeks. I still see a flush this weak based on lack of strength in adx, and rsi possibly down to 624- 619 if not this week, next.
I also see the possibility due to weakness again that we drop immediately this week instead of a 14 day outlook this could very well be playing out this week, again maybe with the assistance of the data incoming this week. In this case if we drop before Wednesday I feel like the weakness will possibly be completed and we will see returning bullishness by end of week Friday or Monday- Tuesday next week. We are very low on the adx, meaning I do see big movement coming and good opportunity to be Ready and Prepared.
watch key support and resistance lines drawn horizontally and angled around trends and gathering of price action. A break of the lines could signal key support (bullishness) or key resistance (bearish) levels. Pay attention to places of interest and watch the bull v bear volume this next few days.
คำจำกัดสิทธิ์ความรับผิดชอบ
ข้อมูลและบทความไม่ได้มีวัตถุประสงค์เพื่อก่อให้เกิดกิจกรรมทางการเงิน, การลงทุน, การซื้อขาย, ข้อเสนอแนะ หรือคำแนะนำประเภทอื่น ๆ ที่ให้หรือรับรองโดย TradingView อ่านเพิ่มเติมที่ ข้อกำหนดการใช้งาน
คำจำกัดสิทธิ์ความรับผิดชอบ
ข้อมูลและบทความไม่ได้มีวัตถุประสงค์เพื่อก่อให้เกิดกิจกรรมทางการเงิน, การลงทุน, การซื้อขาย, ข้อเสนอแนะ หรือคำแนะนำประเภทอื่น ๆ ที่ให้หรือรับรองโดย TradingView อ่านเพิ่มเติมที่ ข้อกำหนดการใช้งาน