Intraday Technical Outlook (15m Chart)
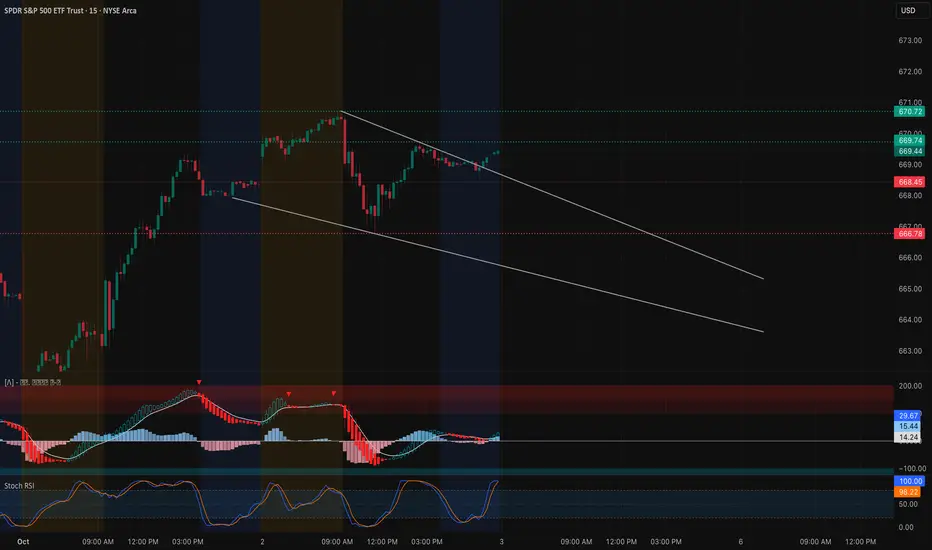
SPY closed near $669.44, consolidating inside a falling wedge pattern. On the 15-minute chart, price is testing downtrend resistance after holding support earlier in the session:
* MACD: Curling back upward from bearish territory, hinting at momentum recovery.
* Stoch RSI: Back at extreme overbought, suggesting buyers are active but may face short-term exhaustion.
* Key Levels: Support sits at $668–666.7, with further downside pressure toward $663.2. Resistance sits at $670.7–671.0, the wedge top and breakout zone.
Intraday takeaway: A breakout above $671 could ignite upside momentum toward $673+. Failure to reclaim $670 risks a fade back toward $666–663.
Options Sentiment & GEX Outlook (1H Chart)

Options flow shows dealers are heavily positioned around key gamma levels:
* Gamma Walls:
* $670–673: Major call wall cluster and highest positive GEX — key resistance ceiling.
* $668: Gamma pivot level where dealers may defend.
* $663–660: Heavy put wall zone that can act as a downside magnet if $668 breaks.
* Implications:
* Holding above $668 keeps SPY pinned toward the $670–673 gamma wall.
* Losing $668 could trigger dealer hedging flows to drag price toward $663–660.
* Volatility Context: IVR at 15.7 is very low, while options skew shows 61.7% puts — indicating hedging remains defensive. Cheap premiums may favor straight directional calls/puts instead of spreads.
My Thoughts & Recommendation
For Oct 3 trading, SPY is tightening for a breakout:
* Intraday (scalping/trading): Watch $670–671 closely. A breakout here favors longs into $673+. If SPY rejects at $671 and breaks $668, expect a pullback toward $663.
* Options trading (swing/0DTE): Calls only make sense if SPY clears $671 with conviction. If SPY fails at $670 and breaks $668, puts toward $663–660 offer better risk/reward.
Bias heading into Oct 3: Neutral with breakout watch — $668 support vs $671 resistance will decide.
Disclaimer: This analysis is for educational purposes only and does not constitute financial advice. Always do your own research and manage risk before trading.
SPY closed near $669.44, consolidating inside a falling wedge pattern. On the 15-minute chart, price is testing downtrend resistance after holding support earlier in the session:
* MACD: Curling back upward from bearish territory, hinting at momentum recovery.
* Stoch RSI: Back at extreme overbought, suggesting buyers are active but may face short-term exhaustion.
* Key Levels: Support sits at $668–666.7, with further downside pressure toward $663.2. Resistance sits at $670.7–671.0, the wedge top and breakout zone.
Intraday takeaway: A breakout above $671 could ignite upside momentum toward $673+. Failure to reclaim $670 risks a fade back toward $666–663.
Options Sentiment & GEX Outlook (1H Chart)
Options flow shows dealers are heavily positioned around key gamma levels:
* Gamma Walls:
* $670–673: Major call wall cluster and highest positive GEX — key resistance ceiling.
* $668: Gamma pivot level where dealers may defend.
* $663–660: Heavy put wall zone that can act as a downside magnet if $668 breaks.
* Implications:
* Holding above $668 keeps SPY pinned toward the $670–673 gamma wall.
* Losing $668 could trigger dealer hedging flows to drag price toward $663–660.
* Volatility Context: IVR at 15.7 is very low, while options skew shows 61.7% puts — indicating hedging remains defensive. Cheap premiums may favor straight directional calls/puts instead of spreads.
My Thoughts & Recommendation
For Oct 3 trading, SPY is tightening for a breakout:
* Intraday (scalping/trading): Watch $670–671 closely. A breakout here favors longs into $673+. If SPY rejects at $671 and breaks $668, expect a pullback toward $663.
* Options trading (swing/0DTE): Calls only make sense if SPY clears $671 with conviction. If SPY fails at $670 and breaks $668, puts toward $663–660 offer better risk/reward.
Bias heading into Oct 3: Neutral with breakout watch — $668 support vs $671 resistance will decide.
Disclaimer: This analysis is for educational purposes only and does not constitute financial advice. Always do your own research and manage risk before trading.
คำจำกัดสิทธิ์ความรับผิดชอบ
ข้อมูลและบทความไม่ได้มีวัตถุประสงค์เพื่อก่อให้เกิดกิจกรรมทางการเงิน, การลงทุน, การซื้อขาย, ข้อเสนอแนะ หรือคำแนะนำประเภทอื่น ๆ ที่ให้หรือรับรองโดย TradingView อ่านเพิ่มเติมที่ ข้อกำหนดการใช้งาน
คำจำกัดสิทธิ์ความรับผิดชอบ
ข้อมูลและบทความไม่ได้มีวัตถุประสงค์เพื่อก่อให้เกิดกิจกรรมทางการเงิน, การลงทุน, การซื้อขาย, ข้อเสนอแนะ หรือคำแนะนำประเภทอื่น ๆ ที่ให้หรือรับรองโดย TradingView อ่านเพิ่มเติมที่ ข้อกำหนดการใช้งาน