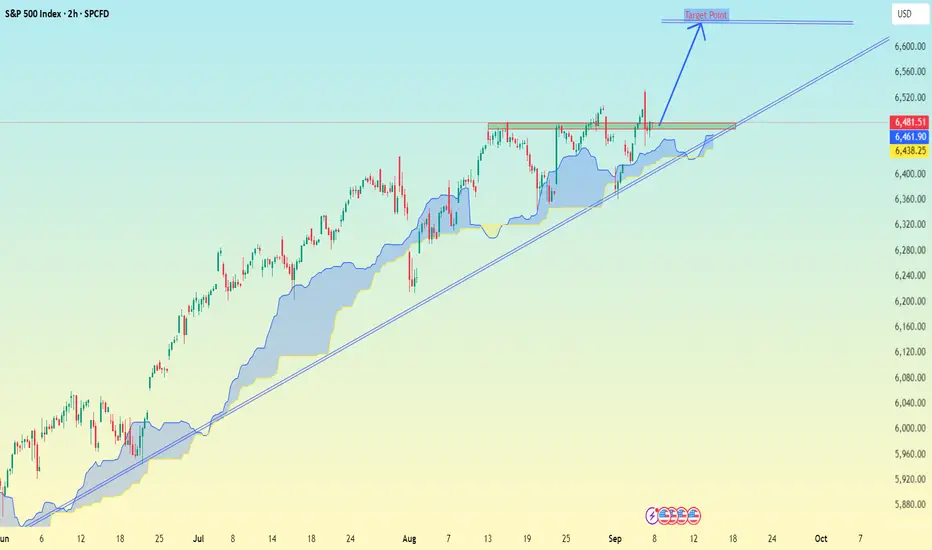
This is a 2h timeframe (SPCFD index, looks like US500 / S&P CFD).
Current price is around 6,403.
I have drawn a falling trendline from July, and price is now near the lower zone.
There’s also volume profile (VPVR) on the right side, showing key liquidity zones.
A target point is marked below, around the 6,200 level.
📌 Target Zone:
My chart suggests a downside target around 6,200 (highlighted with the blue arrow).
⚠ Notes:
If 6,400 support breaks clearly, sellers may push toward 6,300 → 6,200.
But if price reclaims above 6,480–6,500, the short-term bearish setup could fail, and we may see a bounce.
👉 Immediate target: 6,200
👉 Stop-loss to watch (invalidating short): above 6,500
📲 Join telegram channel free .
t.me/addlist/dg3uSwzkMSplNjFk
Forex, Gold & Crypto Signals with detailed analysis & get consistent results.
t.me/addlist/dg3uSwzkMSplNjFk
Gold Signal's with proper TP & SL for high profit opportunities.
t.me/addlist/dg3uSwzkMSplNjFk
Forex, Gold & Crypto Signals with detailed analysis & get consistent results.
t.me/addlist/dg3uSwzkMSplNjFk
Gold Signal's with proper TP & SL for high profit opportunities.
การนำเสนอที่เกี่ยวข้อง
คำจำกัดสิทธิ์ความรับผิดชอบ
ข้อมูลและบทความไม่ได้มีวัตถุประสงค์เพื่อก่อให้เกิดกิจกรรมทางการเงิน, การลงทุน, การซื้อขาย, ข้อเสนอแนะ หรือคำแนะนำประเภทอื่น ๆ ที่ให้หรือรับรองโดย TradingView อ่านเพิ่มเติมที่ ข้อกำหนดการใช้งาน