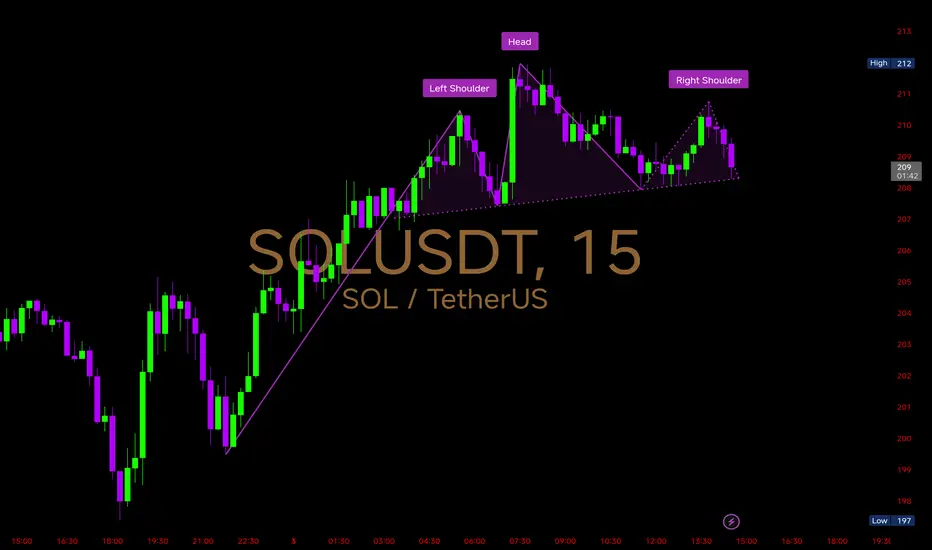
A Head & Shoulders pattern has formed with the left shoulder near 210, head at 212, and right shoulder around 211.
Key Technical Levels
Neckline Support: Around 208 – if this breaks decisively, we could see stronger bearish momentum.
Immediate Resistance: 210–212 (right shoulder + recent high). A breakout above invalidates the bearish pattern.
Downside Targets: If the neckline fails, price could test 205 → 202 → 197 support zones.
Bullish Case: Sustaining above 212 would flip the structure invalid, pushing price back into 215–220 zone.
Right now, #SOLANA is at a critical point – holding above the neckline keeps bulls alive, but losing it confirms a bearish breakdown.
คำจำกัดสิทธิ์ความรับผิดชอบ
ข้อมูลและบทความไม่ได้มีวัตถุประสงค์เพื่อก่อให้เกิดกิจกรรมทางการเงิน, การลงทุน, การซื้อขาย, ข้อเสนอแนะ หรือคำแนะนำประเภทอื่น ๆ ที่ให้หรือรับรองโดย TradingView อ่านเพิ่มเติมที่ ข้อกำหนดการใช้งาน
คำจำกัดสิทธิ์ความรับผิดชอบ
ข้อมูลและบทความไม่ได้มีวัตถุประสงค์เพื่อก่อให้เกิดกิจกรรมทางการเงิน, การลงทุน, การซื้อขาย, ข้อเสนอแนะ หรือคำแนะนำประเภทอื่น ๆ ที่ให้หรือรับรองโดย TradingView อ่านเพิ่มเติมที่ ข้อกำหนดการใช้งาน