Indicators Used in the Setup
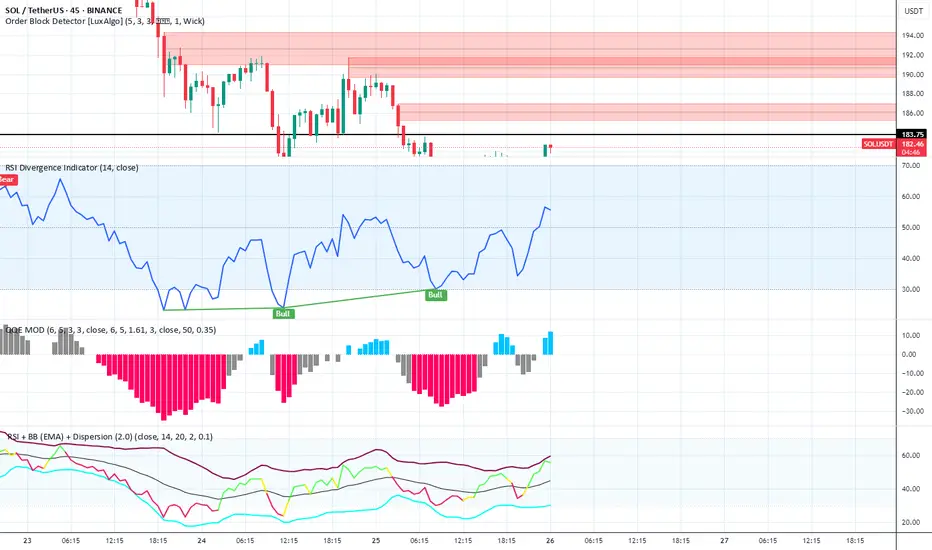
Order Block Detector [LuxAlgo]
Settings: (5, 3, 3), 1 Wick
Function: Highlights institutional order blocks to identify high-probability supply/demand zones.
Chart Insight: Multiple bearish order blocks marked in red between $186–$194, confirming strong overhead resistance. Price is reacting at the lower boundary (~$183.75), showing signs of rejection.
RSI Divergence Indicator (14)
Settings: 14-period RSI
Function: Detects bullish and bearish divergences between price and RSI.
Chart Insight: Bullish Divergence identified — price made a lower low while RSI made a higher low, signaling a potential trend reversal or bullish bounce.
QQE MOD
Settings: (6, 5, 3), Smoothing: 6.5, RSI Length: 14
Function: A momentum oscillator derived from RSI with smoothing and histogram representation.
Chart Insight:
Histogram flipped from red (bearish) to blue (bullish).
Bullish transition suggests increasing momentum in favor of bulls.
TSI – BB (EMA) + Dispersion
Function: Combines True Strength Index with Bollinger Band (EMA-based) and dispersion overlays.
Chart Insight:
TSI is rising toward midline with narrowing dispersion bands.
Indicates a potential volatility contraction before an expansion — likely upside if TSI crosses above signal.
คำจำกัดสิทธิ์ความรับผิดชอบ
ข้อมูลและบทความไม่ได้มีวัตถุประสงค์เพื่อก่อให้เกิดกิจกรรมทางการเงิน, การลงทุน, การซื้อขาย, ข้อเสนอแนะ หรือคำแนะนำประเภทอื่น ๆ ที่ให้หรือรับรองโดย TradingView อ่านเพิ่มเติมที่ ข้อกำหนดการใช้งาน
คำจำกัดสิทธิ์ความรับผิดชอบ
ข้อมูลและบทความไม่ได้มีวัตถุประสงค์เพื่อก่อให้เกิดกิจกรรมทางการเงิน, การลงทุน, การซื้อขาย, ข้อเสนอแนะ หรือคำแนะนำประเภทอื่น ๆ ที่ให้หรือรับรองโดย TradingView อ่านเพิ่มเติมที่ ข้อกำหนดการใช้งาน