1. Market Structure Overview
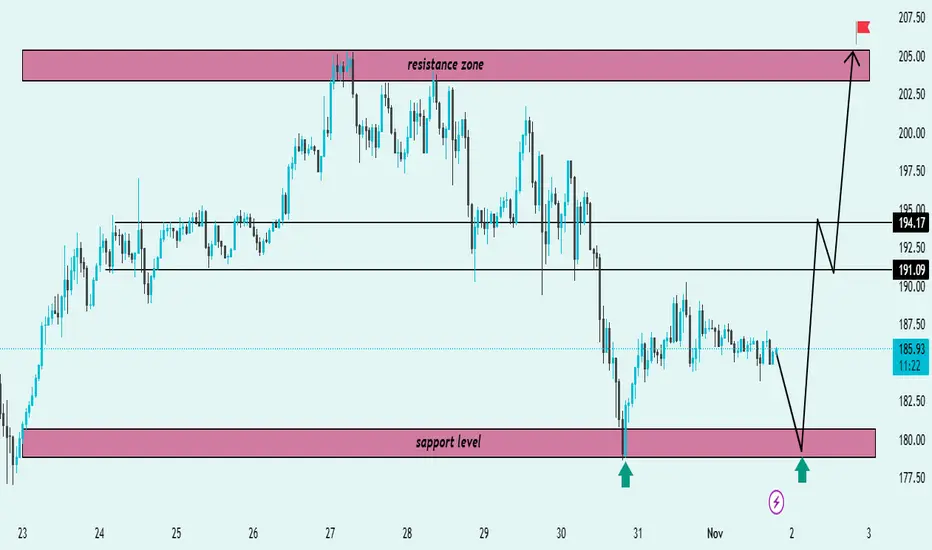
The chart shows Solana (SOL/USDT) trading within a well-defined range between a support level (~$179–$182) and a resistance zone (~$203–$207).
The price has recently tested the support zone multiple times (marked by green arrows), confirming its strength as a key demand area.
2. Key Technical Levels
Support Level: $179–$182 → Major demand zone where price has bounced twice.
Resistance Zone: $203–$207 → Supply area where previous rallies have reversed.
Mid-level Zones:
$191.09: Intermediate resistance (potential short-term reaction point).
$194.17: Secondary resistance before the upper target zone.
3. Price Action Insight
Price is currently consolidating around $185, showing indecision after a prior drop.
The black projection arrows suggest a potential liquidity sweep of the support zone before a bullish reversal.
Expected structure:
A final dip toward $180 to retest support.
A bullish reaction leading to a higher low formation.
A break above $191–$194, confirming bullish continuation.
A final push toward the resistance zone ($205) — the main target.
4. Trade Bias
Bias: Bullish from support
Confirmation Needed: Strong bullish candle or breakout from $191 resistance.
Invalidation: Daily close below $178 support.
5. Target Projection
Primary Target: $194
Final Target: $205 (resistance zone / flagged target)
Summary:
SOL/USDT is showing a potential bullish reversal setup from the $180 support zone. If price confirms strength with a bounce and breaks above $191–$194, the next rally could target the $205 resistance zone. A breakdown below $178 would invalidate the bullish scenario.
การซื้อขายยังคงดำเนินอยู่
JOIN MY TELEGRAM CHANNEL LINK 👇🏻
t.me/Classicallegendschool
t.me/Classicallegendschool
คำจำกัดสิทธิ์ความรับผิดชอบ
ข้อมูลและบทความไม่ได้มีวัตถุประสงค์เพื่อก่อให้เกิดกิจกรรมทางการเงิน, การลงทุน, การซื้อขาย, ข้อเสนอแนะ หรือคำแนะนำประเภทอื่น ๆ ที่ให้หรือรับรองโดย TradingView อ่านเพิ่มเติมที่ ข้อกำหนดการใช้งาน