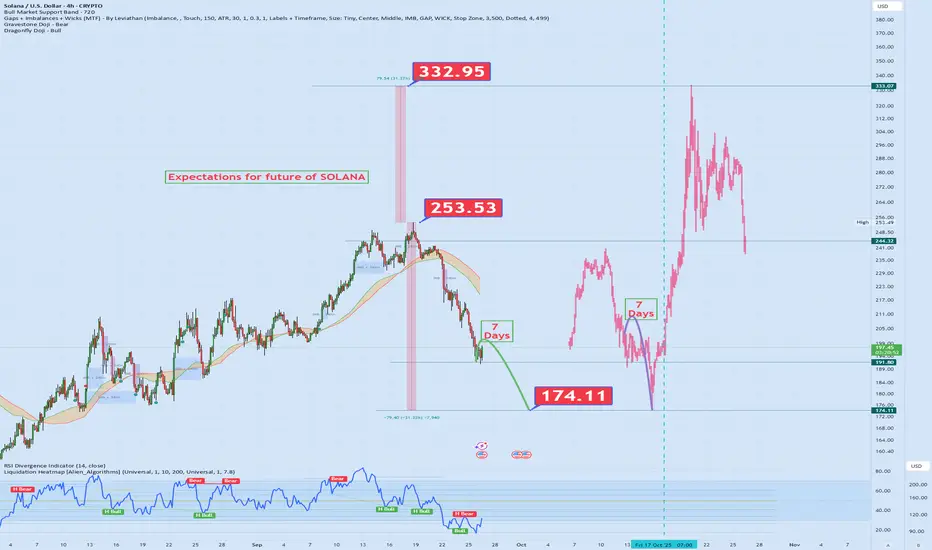
I've combined past price action with future possibilities on the SOL chart. Here are the key highlights:
🚀 Peak Level: 332.95 📉 Correction Zone: 253.53 🛑 Support Area: 174.11
📍 Supported by RSI and moving averages, the red line represents my personal expectation. It points to a potential recovery and a new bullish trend. 💥
🔁 I’ve mapped out scenario-based planning using historical price behavior—now my eyes are on that red trajectory! 💡 Technical analysis + intuition = strategic positioning!
📌 What do you think? Will this scenario play out? Drop your thoughts below! 👇
คำจำกัดสิทธิ์ความรับผิดชอบ
ข้อมูลและบทความไม่ได้มีวัตถุประสงค์เพื่อก่อให้เกิดกิจกรรมทางการเงิน, การลงทุน, การซื้อขาย, ข้อเสนอแนะ หรือคำแนะนำประเภทอื่น ๆ ที่ให้หรือรับรองโดย TradingView อ่านเพิ่มเติมที่ ข้อกำหนดการใช้งาน
คำจำกัดสิทธิ์ความรับผิดชอบ
ข้อมูลและบทความไม่ได้มีวัตถุประสงค์เพื่อก่อให้เกิดกิจกรรมทางการเงิน, การลงทุน, การซื้อขาย, ข้อเสนอแนะ หรือคำแนะนำประเภทอื่น ๆ ที่ให้หรือรับรองโดย TradingView อ่านเพิ่มเติมที่ ข้อกำหนดการใช้งาน