Today, I would like to share my current view of the Solana chart with you. I am currently tracking three possible scenarios:
Scenario 1 – Preferred: ABC correction to wave 2
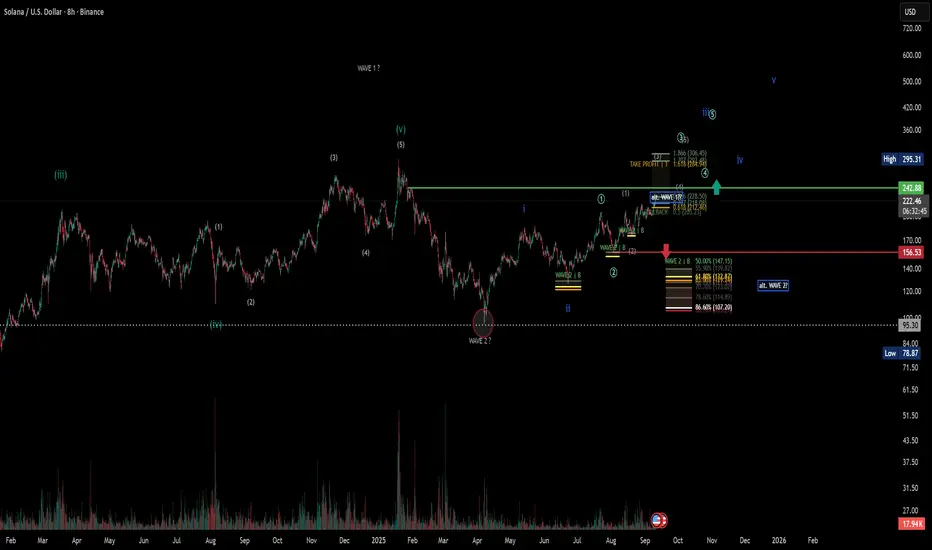
In this scenario, I assume that Solana has not yet found its final bottom at around $95 on April 7, 2025.
In my opinion, wave A was only completed at that point.
We are currently moving correctively in wave B before a larger sell-off begins in wave 2.
For wave B, I expect targets in the range of $276–300.
If this range is clearly exceeded, a wave B extension to around $419 is also possible (regular chart).
https://www.tradingview.com/x/SJsb0d0F/
Variant 2 – Long wave 4 (less preferred)
https://www.tradingview.com/x/c6igiQog/
In this case, wave 4 would be completed on April 7, 2025, after an extended correction (ABC with overshooting wave B).
We would now already be in the final wave 5.
This would have potential up to the 0.618 level at around USD 516 or higher.
Important: I am looking at this variant in the logarithmic chart, as otherwise the levels do not fit neatly.
Nevertheless, this scenario is not my preferred assumption at present.
Variant 3 – very bullish scenario
https://www.tradingview.com/x/2iXbK6g8/
Another possibility would be that wave 2 was already completed on April 7, 2025.
In this case, we would already be in a new uptrend with several 1/2 structures, which would make the chart look very bullish.
Confirmation would come if the $300 mark were to be sustainably exceeded – then this scenario could quickly become the primary one.
However, as the structure is not yet convincing, I remain cautious and continue to favor the ABC correction (scenario 1).
📌 Summary
My main scenario remains an ABC correction to wave 2 with a possible bottom between $50 and $30 (this is also where my long-term risk management lies).
Nevertheless, the various variants present exciting opportunities for traders, both in the short and medium term.
Solana therefore remains a coin that I continue to monitor very closely – especially in conjunction with the Bitcoin chart. This could also still be in a wave 4 correction before the final upward move takes place.
Scenario 1 – Preferred: ABC correction to wave 2
In this scenario, I assume that Solana has not yet found its final bottom at around $95 on April 7, 2025.
In my opinion, wave A was only completed at that point.
We are currently moving correctively in wave B before a larger sell-off begins in wave 2.
For wave B, I expect targets in the range of $276–300.
If this range is clearly exceeded, a wave B extension to around $419 is also possible (regular chart).
https://www.tradingview.com/x/SJsb0d0F/
Variant 2 – Long wave 4 (less preferred)
https://www.tradingview.com/x/c6igiQog/
In this case, wave 4 would be completed on April 7, 2025, after an extended correction (ABC with overshooting wave B).
We would now already be in the final wave 5.
This would have potential up to the 0.618 level at around USD 516 or higher.
Important: I am looking at this variant in the logarithmic chart, as otherwise the levels do not fit neatly.
Nevertheless, this scenario is not my preferred assumption at present.
Variant 3 – very bullish scenario
https://www.tradingview.com/x/2iXbK6g8/
Another possibility would be that wave 2 was already completed on April 7, 2025.
In this case, we would already be in a new uptrend with several 1/2 structures, which would make the chart look very bullish.
Confirmation would come if the $300 mark were to be sustainably exceeded – then this scenario could quickly become the primary one.
However, as the structure is not yet convincing, I remain cautious and continue to favor the ABC correction (scenario 1).
📌 Summary
My main scenario remains an ABC correction to wave 2 with a possible bottom between $50 and $30 (this is also where my long-term risk management lies).
Nevertheless, the various variants present exciting opportunities for traders, both in the short and medium term.
Solana therefore remains a coin that I continue to monitor very closely – especially in conjunction with the Bitcoin chart. This could also still be in a wave 4 correction before the final upward move takes place.
คำจำกัดสิทธิ์ความรับผิดชอบ
ข้อมูลและบทความไม่ได้มีวัตถุประสงค์เพื่อก่อให้เกิดกิจกรรมทางการเงิน, การลงทุน, การซื้อขาย, ข้อเสนอแนะ หรือคำแนะนำประเภทอื่น ๆ ที่ให้หรือรับรองโดย TradingView อ่านเพิ่มเติมใน ข้อกำหนดการใช้งาน
คำจำกัดสิทธิ์ความรับผิดชอบ
ข้อมูลและบทความไม่ได้มีวัตถุประสงค์เพื่อก่อให้เกิดกิจกรรมทางการเงิน, การลงทุน, การซื้อขาย, ข้อเสนอแนะ หรือคำแนะนำประเภทอื่น ๆ ที่ให้หรือรับรองโดย TradingView อ่านเพิ่มเติมใน ข้อกำหนดการใช้งาน