Solana (1H Chart) - Breakout-Retest Long Trade
This is a long trade setup for Solana perpetual futures based on a breakout and retest structure, placed on the 1-hour chart.
Trade Overview
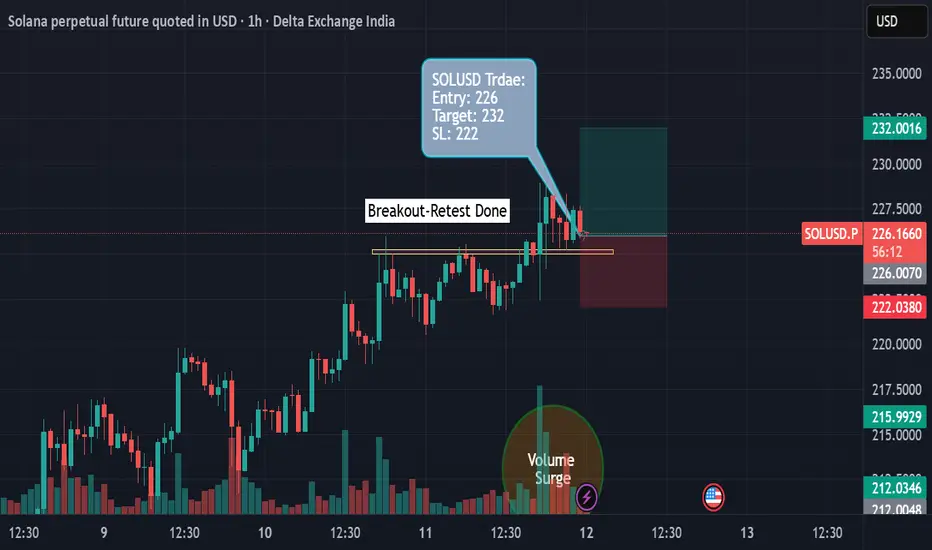
• The chart shows price consolidating near a horizontal resistance zone (yellow line), followed by a breakout above this level and a subsequent retest.
• The entry is taken after confirmation of support at the breakout zone, aiming for a move toward the upper target.
Entry, Target, and Stop-Loss
• Entry: Around 226 USD, following a successful retest of the yellow breakout level.
• Target: 232 USD, marked in green at the upper end of the chart’s risk-reward box.
• Stop-Loss: 222 USD, just below the retest zone, minimizing risk if price reverses.
Trade Logic and Reasoning
• The trade capitalizes on a classic breakout-retest pattern, where price first breaks resistance and then tests it as new support.
• Increasing volume near the breakout supports bullish momentum.
• Risk management is prominent, with a clear stop-loss set below the retest area.
Risk/Reward Profile
This setup offers a favorable risk-to-reward ratio, as visualized by the green/red shaded box indicating potential gain versus loss for the position.
Trade Overview
• The chart shows price consolidating near a horizontal resistance zone (yellow line), followed by a breakout above this level and a subsequent retest.
• The entry is taken after confirmation of support at the breakout zone, aiming for a move toward the upper target.
Entry, Target, and Stop-Loss
• Entry: Around 226 USD, following a successful retest of the yellow breakout level.
• Target: 232 USD, marked in green at the upper end of the chart’s risk-reward box.
• Stop-Loss: 222 USD, just below the retest zone, minimizing risk if price reverses.
Trade Logic and Reasoning
• The trade capitalizes on a classic breakout-retest pattern, where price first breaks resistance and then tests it as new support.
• Increasing volume near the breakout supports bullish momentum.
• Risk management is prominent, with a clear stop-loss set below the retest area.
Risk/Reward Profile
This setup offers a favorable risk-to-reward ratio, as visualized by the green/red shaded box indicating potential gain versus loss for the position.
การซื้อขายยังคงดำเนินอยู่
Entered at 226, Let the magic begins :)ปิดการเทรด: ถึงเป้าหมายการทำกำไร
One shot Momentum 🔥Done and Dusted ⚡️🥳
Solana 226 to 232 :)
คำจำกัดสิทธิ์ความรับผิดชอบ
ข้อมูลและบทความไม่ได้มีวัตถุประสงค์เพื่อก่อให้เกิดกิจกรรมทางการเงิน, การลงทุน, การซื้อขาย, ข้อเสนอแนะ หรือคำแนะนำประเภทอื่น ๆ ที่ให้หรือรับรองโดย TradingView อ่านเพิ่มเติมใน ข้อกำหนดการใช้งาน
คำจำกัดสิทธิ์ความรับผิดชอบ
ข้อมูลและบทความไม่ได้มีวัตถุประสงค์เพื่อก่อให้เกิดกิจกรรมทางการเงิน, การลงทุน, การซื้อขาย, ข้อเสนอแนะ หรือคำแนะนำประเภทอื่น ๆ ที่ให้หรือรับรองโดย TradingView อ่านเพิ่มเติมใน ข้อกำหนดการใช้งาน