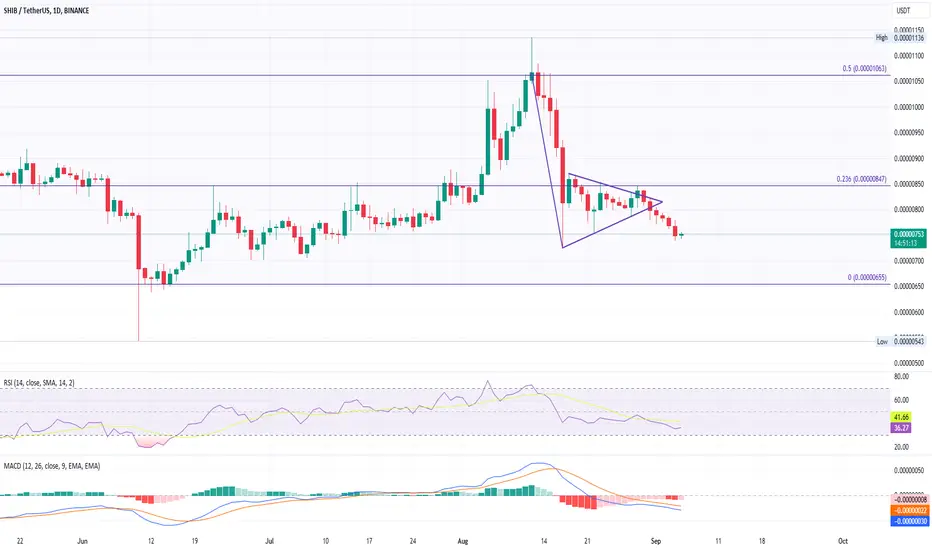
SHIB price breaks a pennant pattern and moves away from the 50-day EMA.
Potential downtrend continuation for SHIB, targeting $0.0000065.
Shiba Inu's 2023 performance shows a 7.64% YTD drop.
SHIB trades at a massive 91.65% discount from its all-time high of $0.00008854.
The 50 and 200-day EMA indicate a bearish trend for SHIB.
SHIB broke its triangle pattern last month, leading to a bearish pennant breakdown.
Over the past six days, SHIB has declined by 10%, currently trading at $0.00000752.
Technical indicators, MACD and RSI, suggest increasing bearish momentum.
Key support levels for SHIB are at $0.0000070 and $0.0000065.
If SHIB breaks above the 50-day EMA, it could target $0.0000090 and potentially $0.000010.
คำจำกัดสิทธิ์ความรับผิดชอบ
ข้อมูลและบทความไม่ได้มีวัตถุประสงค์เพื่อก่อให้เกิดกิจกรรมทางการเงิน, การลงทุน, การซื้อขาย, ข้อเสนอแนะ หรือคำแนะนำประเภทอื่น ๆ ที่ให้หรือรับรองโดย TradingView อ่านเพิ่มเติมที่ ข้อกำหนดการใช้งาน
คำจำกัดสิทธิ์ความรับผิดชอบ
ข้อมูลและบทความไม่ได้มีวัตถุประสงค์เพื่อก่อให้เกิดกิจกรรมทางการเงิน, การลงทุน, การซื้อขาย, ข้อเสนอแนะ หรือคำแนะนำประเภทอื่น ๆ ที่ให้หรือรับรองโดย TradingView อ่านเพิ่มเติมที่ ข้อกำหนดการใช้งาน