4-Hour Chart (Swing Context)
Trend: The Sensex index is currently in an ascending channel formation after a prior downtrend.
Key Zone: The price is approaching the 82,700-82,800 supply zone, which is a significant resistance area.
Previous Break: The price has broken above the 81,800 level, which is now acting as a potential demand zone.
Bias: The overall momentum is bullish, but the price is currently within a major resistance zone.
1-Hour Chart (Intraday Context)
Structure: The price action is forming a clear pattern of higher highs and higher lows, indicating a bullish structure.
Support: The 81,800 level, which was previously resistance, is now acting as a support zone and showing strong bounces.
Current Action: The price is currently consolidating below the 82,700-82,800 supply zone.
BOS: The buying order flow is still dominant, but the upside liquidity appears to be thinning.
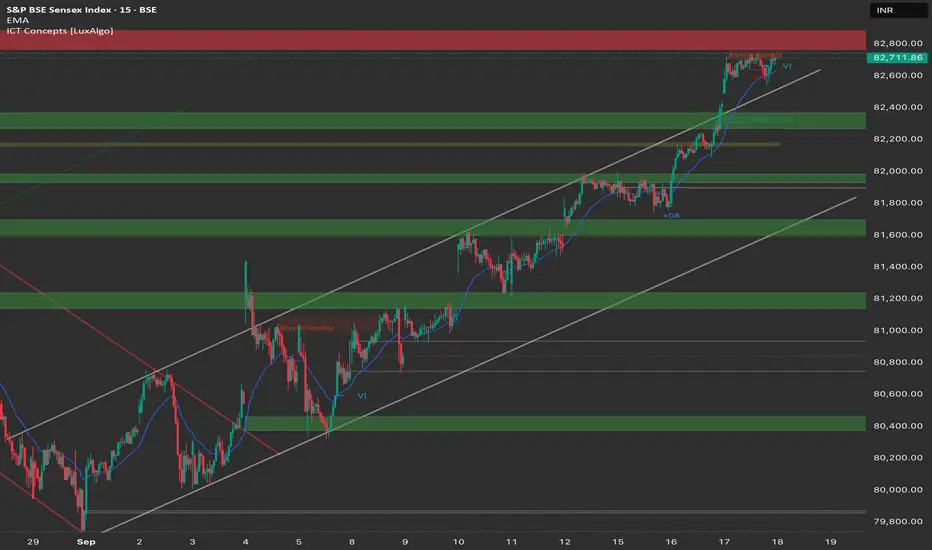
15-Minute Chart (Execution View)
Action: The price is in a sideways consolidation pattern below the 82,650 level. OB: The order block around 81,700-81,800 is acting as a support buffer.
FVG: Minor FVGs in the 82,000-82,100 zone may offer intraday support.
Channel: The price is respecting the ascending channel boundaries.
Trade Plan (18th September)
Bullish Scenario
Entry: Buy on a retracement towards the 81,700-81,800 demand zone (OB + structure support).
Targets:
TP1: 82,400 (intraday liquidity)
TP2: 82,700-82,800 (supply zone top & channel resistance)
Stop Loss: Below 81,600 (channel bottom & invalidation).
Bearish Scenario
Entry: Short on a rejection of the 82,700-82,800 supply zone with a strong bearish signal (e.g., engulfing candle).
Targets:
TP1: 82,100 (potential FVG fill)
TP2: 81,700-81,800 (major demand zone/OB)
Stop Loss: Above 82,800.
Bias: Neutral-to-Bullish. Expecting a potential pullback to 81,700-81,800 before a move towards the 82,700-82,800 resistance zone.
Caution: If the 81,700-81,800 demand zone fails to hold, expect a further downside acceleration towards 81,500-81,300.
Trend: The Sensex index is currently in an ascending channel formation after a prior downtrend.
Key Zone: The price is approaching the 82,700-82,800 supply zone, which is a significant resistance area.
Previous Break: The price has broken above the 81,800 level, which is now acting as a potential demand zone.
Bias: The overall momentum is bullish, but the price is currently within a major resistance zone.
1-Hour Chart (Intraday Context)
Structure: The price action is forming a clear pattern of higher highs and higher lows, indicating a bullish structure.
Support: The 81,800 level, which was previously resistance, is now acting as a support zone and showing strong bounces.
Current Action: The price is currently consolidating below the 82,700-82,800 supply zone.
BOS: The buying order flow is still dominant, but the upside liquidity appears to be thinning.
15-Minute Chart (Execution View)
Action: The price is in a sideways consolidation pattern below the 82,650 level. OB: The order block around 81,700-81,800 is acting as a support buffer.
FVG: Minor FVGs in the 82,000-82,100 zone may offer intraday support.
Channel: The price is respecting the ascending channel boundaries.
Trade Plan (18th September)
Bullish Scenario
Entry: Buy on a retracement towards the 81,700-81,800 demand zone (OB + structure support).
Targets:
TP1: 82,400 (intraday liquidity)
TP2: 82,700-82,800 (supply zone top & channel resistance)
Stop Loss: Below 81,600 (channel bottom & invalidation).
Bearish Scenario
Entry: Short on a rejection of the 82,700-82,800 supply zone with a strong bearish signal (e.g., engulfing candle).
Targets:
TP1: 82,100 (potential FVG fill)
TP2: 81,700-81,800 (major demand zone/OB)
Stop Loss: Above 82,800.
Bias: Neutral-to-Bullish. Expecting a potential pullback to 81,700-81,800 before a move towards the 82,700-82,800 resistance zone.
Caution: If the 81,700-81,800 demand zone fails to hold, expect a further downside acceleration towards 81,500-81,300.
คำจำกัดสิทธิ์ความรับผิดชอบ
ข้อมูลและบทความไม่ได้มีวัตถุประสงค์เพื่อก่อให้เกิดกิจกรรมทางการเงิน, การลงทุน, การซื้อขาย, ข้อเสนอแนะ หรือคำแนะนำประเภทอื่น ๆ ที่ให้หรือรับรองโดย TradingView อ่านเพิ่มเติมใน ข้อกำหนดการใช้งาน
คำจำกัดสิทธิ์ความรับผิดชอบ
ข้อมูลและบทความไม่ได้มีวัตถุประสงค์เพื่อก่อให้เกิดกิจกรรมทางการเงิน, การลงทุน, การซื้อขาย, ข้อเสนอแนะ หรือคำแนะนำประเภทอื่น ๆ ที่ให้หรือรับรองโดย TradingView อ่านเพิ่มเติมใน ข้อกำหนดการใช้งาน