Detailed Market Structure Breakdown
4-Hour Chart (Macro Trend)
Structure: The Sensex is showing a clear rejection from the major supply zone of 82,300 - 82,500. The large red candle on the 4H chart indicates profit-booking and a likely retreat back into the consolidation range. The price broke below the lower trendline of the very steep short-term ascending channel.
Key Levels:
Major Supply (Resistance): 82,300 - 82,500. This remains the critical overhead hurdle and a short-term Order Block (OB).
Major Demand (Support): 81,400 - 81,600. This area, which includes the rising trendline and a prior FVG (Fair Value Gap), is the must-hold zone for the bulls.
Outlook: The trend has shifted to sideways-to-bearish. The market is expected to test the 81,400 - 81,600 support zone.
1-Hour Chart (Intermediate View)
Structure: The 1H chart shows a clear Market Structure Shift (MSS) to the downside. The price broke the immediate swing low and the lower trendline of the ascending channel, confirming the shift to a corrective short-term trend. The market is now trading within a small descending channel.
Key Levels:
Immediate Resistance: 82,000 (The psychological level and the middle of the recent bullish candle).
Immediate Support: 81,600 (The major support zone).
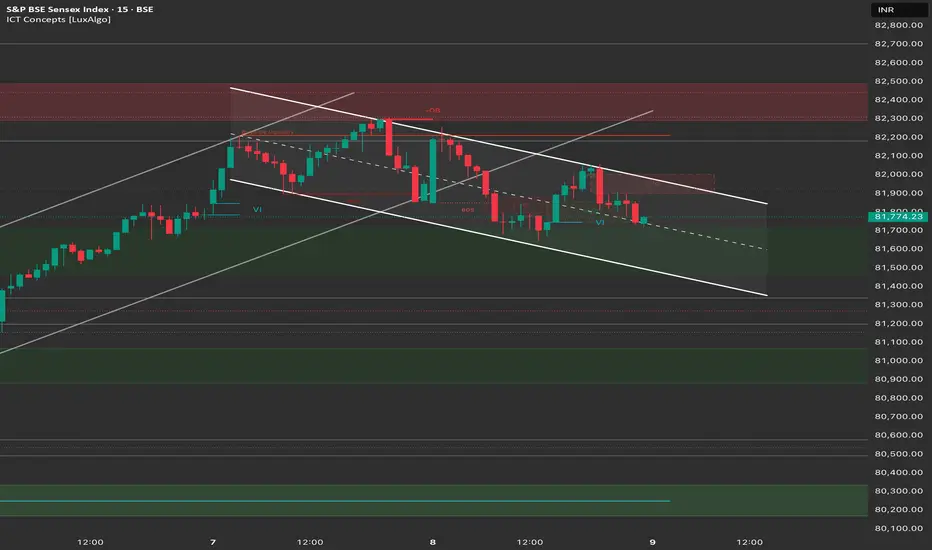
15-Minute Chart (Intraday View)
Structure: The 15M chart confirms a clean descending channel since the 82,300 high, marked by lower highs and lower lows. The market closed right at the 81,774 level, indicating bears are in control for the start of the session.
Key Levels:
Intraday Supply: 81,900 - 82,000. This area is the immediate swing high.
Intraday Demand: 81,600.
Outlook: Bearish. A "Sell on Rise" strategy is recommended near 81,900 - 82,000.
📈 Trade Plan (Thursday, 9th October)
Market Outlook: The Sensex has initiated a short-term correction after hitting major resistance. The plan focuses on capitalizing on the continuation of the correction.
Bearish Scenario (Primary Plan)
Justification: The breakdown of the steep channel and the rejection from 82,300 favor continuation toward the next major support.
Entry: Short entry on a successful retest and rejection of the 81,900 - 82,000 zone (upper channel resistance/prior support). Alternatively, short a decisive break and 15-minute candle close below 81,600.
Stop Loss (SL): Place a stop loss above 82,200 (above the immediate swing high).
Targets:
T1: 81,400 (Major FVG support).
T2: 81,000 (Psychological support).
Bullish Scenario (Counter-Trend/Reversal Plan)
Justification: Only valid if TCS results are exceptionally strong, leading to a gap-up or sharp reversal that negates the current selling pressure.
Trigger: A sustained move and close above the major resistance at 82,300.
Entry: Long entry on a confirmed 15-minute close above 82,300.
Stop Loss (SL): Below 82,000.
Targets:
T1: 82,600 (Upper resistance).
T2: 83,000 (Psychological target).
Key Levels for Observation:
Immediate Decision Point: 81,600 - 82,000 zone.
Bearish Confirmation: A break and sustained move below 81,600.
Bullish Confirmation: A move back above 82,200.
Major Event: TCS Q2 Results. Volatility is expected to be high.
Line in the Sand: 81,400. A break below this would accelerate the correction.
4-Hour Chart (Macro Trend)
Structure: The Sensex is showing a clear rejection from the major supply zone of 82,300 - 82,500. The large red candle on the 4H chart indicates profit-booking and a likely retreat back into the consolidation range. The price broke below the lower trendline of the very steep short-term ascending channel.
Key Levels:
Major Supply (Resistance): 82,300 - 82,500. This remains the critical overhead hurdle and a short-term Order Block (OB).
Major Demand (Support): 81,400 - 81,600. This area, which includes the rising trendline and a prior FVG (Fair Value Gap), is the must-hold zone for the bulls.
Outlook: The trend has shifted to sideways-to-bearish. The market is expected to test the 81,400 - 81,600 support zone.
1-Hour Chart (Intermediate View)
Structure: The 1H chart shows a clear Market Structure Shift (MSS) to the downside. The price broke the immediate swing low and the lower trendline of the ascending channel, confirming the shift to a corrective short-term trend. The market is now trading within a small descending channel.
Key Levels:
Immediate Resistance: 82,000 (The psychological level and the middle of the recent bullish candle).
Immediate Support: 81,600 (The major support zone).
15-Minute Chart (Intraday View)
Structure: The 15M chart confirms a clean descending channel since the 82,300 high, marked by lower highs and lower lows. The market closed right at the 81,774 level, indicating bears are in control for the start of the session.
Key Levels:
Intraday Supply: 81,900 - 82,000. This area is the immediate swing high.
Intraday Demand: 81,600.
Outlook: Bearish. A "Sell on Rise" strategy is recommended near 81,900 - 82,000.
📈 Trade Plan (Thursday, 9th October)
Market Outlook: The Sensex has initiated a short-term correction after hitting major resistance. The plan focuses on capitalizing on the continuation of the correction.
Bearish Scenario (Primary Plan)
Justification: The breakdown of the steep channel and the rejection from 82,300 favor continuation toward the next major support.
Entry: Short entry on a successful retest and rejection of the 81,900 - 82,000 zone (upper channel resistance/prior support). Alternatively, short a decisive break and 15-minute candle close below 81,600.
Stop Loss (SL): Place a stop loss above 82,200 (above the immediate swing high).
Targets:
T1: 81,400 (Major FVG support).
T2: 81,000 (Psychological support).
Bullish Scenario (Counter-Trend/Reversal Plan)
Justification: Only valid if TCS results are exceptionally strong, leading to a gap-up or sharp reversal that negates the current selling pressure.
Trigger: A sustained move and close above the major resistance at 82,300.
Entry: Long entry on a confirmed 15-minute close above 82,300.
Stop Loss (SL): Below 82,000.
Targets:
T1: 82,600 (Upper resistance).
T2: 83,000 (Psychological target).
Key Levels for Observation:
Immediate Decision Point: 81,600 - 82,000 zone.
Bearish Confirmation: A break and sustained move below 81,600.
Bullish Confirmation: A move back above 82,200.
Major Event: TCS Q2 Results. Volatility is expected to be high.
Line in the Sand: 81,400. A break below this would accelerate the correction.
คำจำกัดสิทธิ์ความรับผิดชอบ
ข้อมูลและบทความไม่ได้มีวัตถุประสงค์เพื่อก่อให้เกิดกิจกรรมทางการเงิน, การลงทุน, การซื้อขาย, ข้อเสนอแนะ หรือคำแนะนำประเภทอื่น ๆ ที่ให้หรือรับรองโดย TradingView อ่านเพิ่มเติมที่ ข้อกำหนดการใช้งาน
คำจำกัดสิทธิ์ความรับผิดชอบ
ข้อมูลและบทความไม่ได้มีวัตถุประสงค์เพื่อก่อให้เกิดกิจกรรมทางการเงิน, การลงทุน, การซื้อขาย, ข้อเสนอแนะ หรือคำแนะนำประเภทอื่น ๆ ที่ให้หรือรับรองโดย TradingView อ่านเพิ่มเติมที่ ข้อกำหนดการใช้งาน