📈 1-Hour Time Frame Technical Overview
On the 1-hour chart, the technical indicators for SBIN futures are as follows:
Moving Averages: Strong Buy
Oscillators: Neutral
Overall Technical Rating: Strong Buy
This suggests a bullish short-term trend, with moving averages indicating upward momentum.
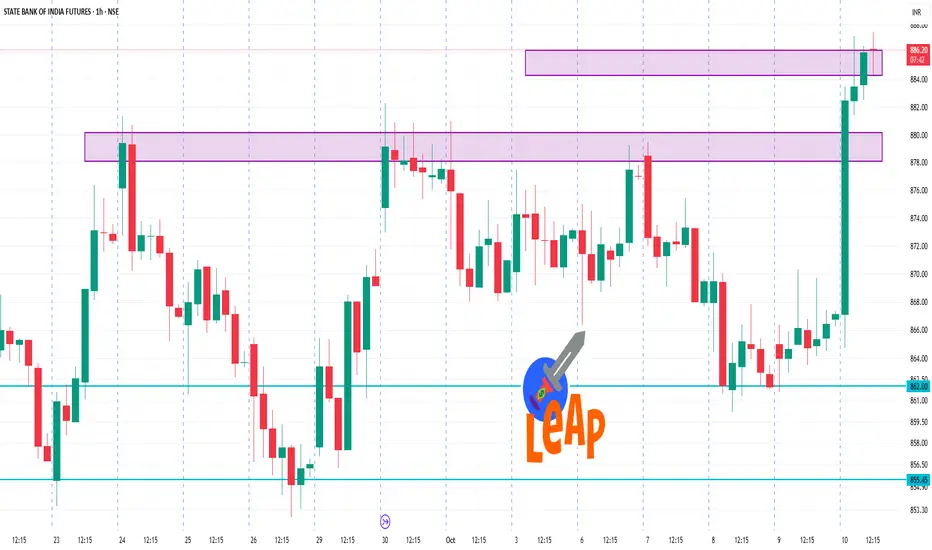
🔄 Key Levels to Watch
Based on recent intraday analysis, the following levels are noteworthy:
Resistance Levels: ₹880.88
Support Levels: ₹863.38
These levels can serve as potential entry or exit points for traders.
📊 Additional Insights
Open Interest: Approximately 94.62 million contracts, indicating active participation.
Volume: Around 13.07 million contracts traded, reflecting healthy liquidity.
On the 1-hour chart, the technical indicators for SBIN futures are as follows:
Moving Averages: Strong Buy
Oscillators: Neutral
Overall Technical Rating: Strong Buy
This suggests a bullish short-term trend, with moving averages indicating upward momentum.
🔄 Key Levels to Watch
Based on recent intraday analysis, the following levels are noteworthy:
Resistance Levels: ₹880.88
Support Levels: ₹863.38
These levels can serve as potential entry or exit points for traders.
📊 Additional Insights
Open Interest: Approximately 94.62 million contracts, indicating active participation.
Volume: Around 13.07 million contracts traded, reflecting healthy liquidity.
การนำเสนอที่เกี่ยวข้อง
คำจำกัดสิทธิ์ความรับผิดชอบ
ข้อมูลและบทความไม่ได้มีวัตถุประสงค์เพื่อก่อให้เกิดกิจกรรมทางการเงิน, การลงทุน, การซื้อขาย, ข้อเสนอแนะ หรือคำแนะนำประเภทอื่น ๆ ที่ให้หรือรับรองโดย TradingView อ่านเพิ่มเติมใน ข้อกำหนดการใช้งาน
การนำเสนอที่เกี่ยวข้อง
คำจำกัดสิทธิ์ความรับผิดชอบ
ข้อมูลและบทความไม่ได้มีวัตถุประสงค์เพื่อก่อให้เกิดกิจกรรมทางการเงิน, การลงทุน, การซื้อขาย, ข้อเสนอแนะ หรือคำแนะนำประเภทอื่น ๆ ที่ให้หรือรับรองโดย TradingView อ่านเพิ่มเติมใน ข้อกำหนดการใช้งาน