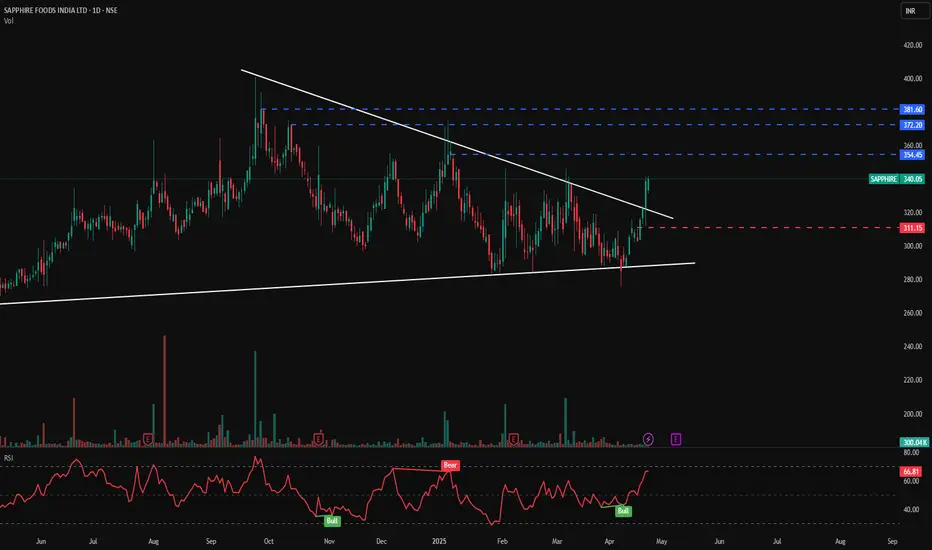
📊 SAPPHIRE FOODS – Bullish Breakout from Falling Wedge
🕰️ Timeframe: 1D | 📉 Pattern: Falling Wedge Breakout
🔍 Technical Breakdown:
SAPPHIRE has broken out of a well-defined falling wedge pattern — a bullish reversal signal — backed by a sharp move on increased volume.
This wedge has been forming since early February, and the recent breakout above the upper trendline suggests renewed momentum and buying interest.
🔑 Key Technical Levels:
🔵 Resistance Zones (Upside Targets):
₹354.45
₹372.20
₹381.60
🔴 Support Zone:
₹311.15 (previous resistance turned support post-breakout)
⚪ Wedge Support Line: Well-held and now acting as a base for this breakout rally
📊 Volume & Indicator Insights:
🔺 Breakout is supported by a volume surge (300K), indicating institutional or smart money participation.
🔄 RSI at 66.81, nearing overbought territory but still in healthy uptrend range — confirming strength.
📉 RSI signals:
Bullish crossover (around ₹300) confirmed breakout
Prior “Bear” signal in Feb has now reversed to “Bull” (label shown)
🧠 Bias: Strongly Bullish
📍 Retest of ₹311–₹320 zone could offer re-entry opportunity with favorable risk-reward.
⚠️ Disclaimer: This chart is for educational purposes only. Please conduct your own due diligence or consult a professional before investing.
📈 Follow for more breakout pattern setups | PriceAction_Pulse
💬 Share your views on this wedge breakout in the comments!
ปิดการเทรด: ถึงเป้าหมายการตัดขาดทุน
คำจำกัดสิทธิ์ความรับผิดชอบ
ข้อมูลและบทความไม่ได้มีวัตถุประสงค์เพื่อก่อให้เกิดกิจกรรมทางการเงิน, การลงทุน, การซื้อขาย, ข้อเสนอแนะ หรือคำแนะนำประเภทอื่น ๆ ที่ให้หรือรับรองโดย TradingView อ่านเพิ่มเติมใน ข้อกำหนดการใช้งาน
คำจำกัดสิทธิ์ความรับผิดชอบ
ข้อมูลและบทความไม่ได้มีวัตถุประสงค์เพื่อก่อให้เกิดกิจกรรมทางการเงิน, การลงทุน, การซื้อขาย, ข้อเสนอแนะ หรือคำแนะนำประเภทอื่น ๆ ที่ให้หรือรับรองโดย TradingView อ่านเพิ่มเติมใน ข้อกำหนดการใช้งาน