While most of the market has been shaking off volatility, Rigetti Computing (RGTI) has quietly exploded into one of the most powerful breakouts in the quantum tech sector.
The weekly and daily charts both tell the same story — a confirmed institutional breakout backed by strength, volume, and perfect momentum alignment.
📆 Weekly Structure
The weekly chart reveals a massive Break of Structure (BOS), with clean bullish continuation candles stacking higher each week. Volume surged to new highs — a sign that institutional accumulation is still in play. The MACD continues to expand upward, showing strong buying momentum, and the Stoch RSI has pinned at 100, signaling a fully charged uptrend, not exhaustion.
As long as RGTI holds above the $24–26 breakout zone, this move remains technically unstoppable.
Key Weekly Levels:
* 🟢 Support: $24–26 (confirmed breakout base)
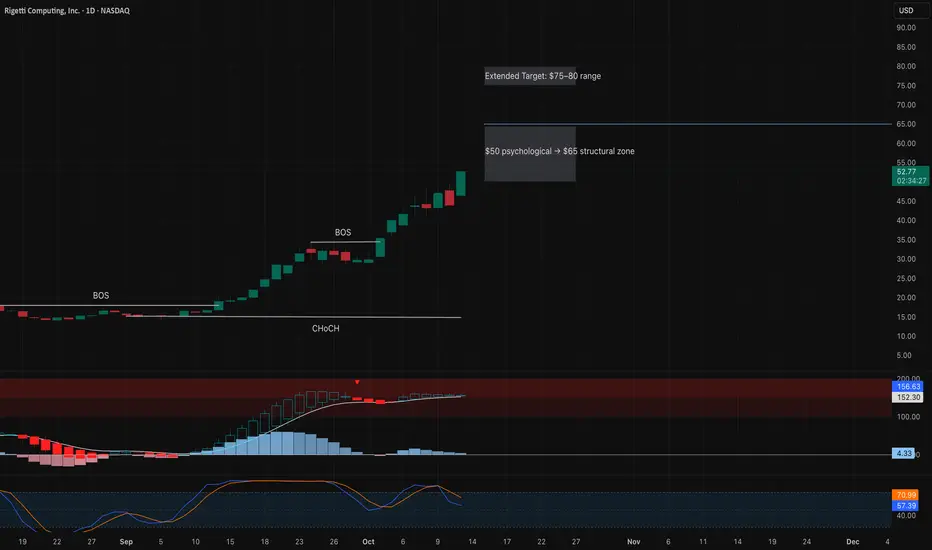
* 🟡 Resistance: $50 psychological → $65 next structural zone
* 🔮 Extended Target: $75–80 range (long-term Fibonacci projection)
📊 Daily Structure
The daily chart confirms the momentum story. After multiple BOS confirmations, price continues to trend in a tight rising channel — every dip has been bought with conviction. MACD remains firmly bullish, and the histogram shows steady strength, suggesting momentum is building for another push higher. Stoch RSI has cooled slightly, indicating there’s still room for continuation before the next consolidation.
If RGTI clears $53–55 with volume, it could easily stretch toward $65–70 in the coming sessions.
🎯 Outlook
RGTI is currently one of the strongest momentum structures in the market — a textbook example of bullish continuation after accumulation. Momentum across all timeframes remains aligned, and as long as $26 holds, the trend bias remains upward.
A minor consolidation around $50–55 would be natural, but the bigger picture still points toward new highs in the $70–80 zone.
💭 Final Thoughts: RGTI is following a classic “smart money trend” pattern — strong BOS, confirmed retests, and no visible weakness in volume or structure. The bulls remain fully in control until proven otherwise.
This analysis is for educational purposes only and does not constitute financial advice. Always manage risk before trading.
📆 Weekly Structure
The weekly chart reveals a massive Break of Structure (BOS), with clean bullish continuation candles stacking higher each week. Volume surged to new highs — a sign that institutional accumulation is still in play. The MACD continues to expand upward, showing strong buying momentum, and the Stoch RSI has pinned at 100, signaling a fully charged uptrend, not exhaustion.
As long as RGTI holds above the $24–26 breakout zone, this move remains technically unstoppable.
Key Weekly Levels:
* 🟢 Support: $24–26 (confirmed breakout base)
* 🟡 Resistance: $50 psychological → $65 next structural zone
* 🔮 Extended Target: $75–80 range (long-term Fibonacci projection)
📊 Daily Structure
The daily chart confirms the momentum story. After multiple BOS confirmations, price continues to trend in a tight rising channel — every dip has been bought with conviction. MACD remains firmly bullish, and the histogram shows steady strength, suggesting momentum is building for another push higher. Stoch RSI has cooled slightly, indicating there’s still room for continuation before the next consolidation.
If RGTI clears $53–55 with volume, it could easily stretch toward $65–70 in the coming sessions.
🎯 Outlook
RGTI is currently one of the strongest momentum structures in the market — a textbook example of bullish continuation after accumulation. Momentum across all timeframes remains aligned, and as long as $26 holds, the trend bias remains upward.
A minor consolidation around $50–55 would be natural, but the bigger picture still points toward new highs in the $70–80 zone.
💭 Final Thoughts: RGTI is following a classic “smart money trend” pattern — strong BOS, confirmed retests, and no visible weakness in volume or structure. The bulls remain fully in control until proven otherwise.
This analysis is for educational purposes only and does not constitute financial advice. Always manage risk before trading.
คำจำกัดสิทธิ์ความรับผิดชอบ
ข้อมูลและบทความไม่ได้มีวัตถุประสงค์เพื่อก่อให้เกิดกิจกรรมทางการเงิน, การลงทุน, การซื้อขาย, ข้อเสนอแนะ หรือคำแนะนำประเภทอื่น ๆ ที่ให้หรือรับรองโดย TradingView อ่านเพิ่มเติมที่ ข้อกำหนดการใช้งาน
คำจำกัดสิทธิ์ความรับผิดชอบ
ข้อมูลและบทความไม่ได้มีวัตถุประสงค์เพื่อก่อให้เกิดกิจกรรมทางการเงิน, การลงทุน, การซื้อขาย, ข้อเสนอแนะ หรือคำแนะนำประเภทอื่น ๆ ที่ให้หรือรับรองโดย TradingView อ่านเพิ่มเติมที่ ข้อกำหนดการใช้งาน