📈 RELIANCE INDUSTRIES LTD – Strong Bullish Breakout!
📅 Date: April 28, 2025
📈 Timeframe: Daily Chart
🔍 Stock: Reliance Industries Ltd (NSE)
📌 Technical Overview:
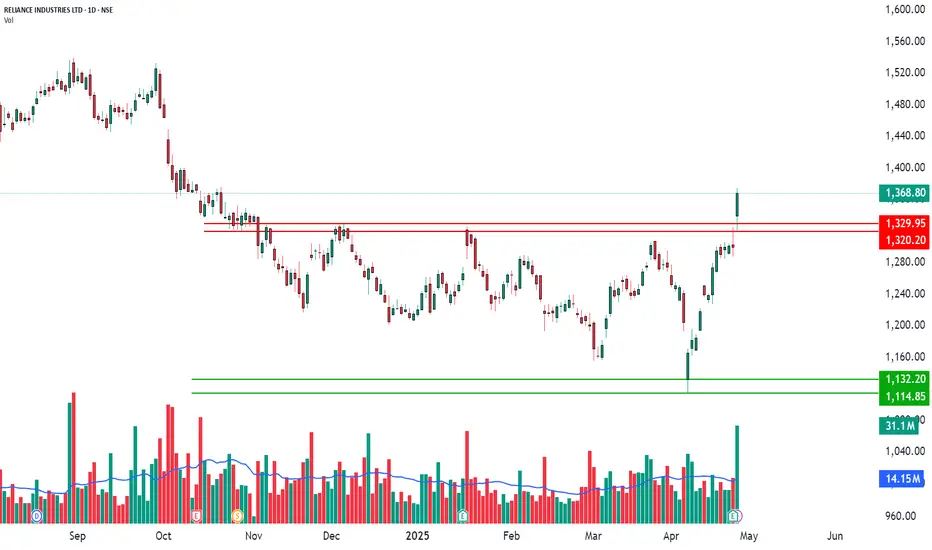
Reliance Industries has shown strong bullish momentum after breaking out above the important level of ₹1300.90.
Several indicators are supporting this breakout:
✅ RSI Breakout – Showing strong strength.
✅ Bollinger Bands Breakout – Price is breaking outside the bands, showing heavy momentum.
✅ Bullish VWAP Trend – Price is trading well above the VWAP line.
✅ TTM Squeeze Breakout – Major squeeze breakout confirms buyers' control.
🧩 Key Levels:
Major Resistance Broken: ₹1300.90 ✅
Immediate Support Now: ₹1329.95 and ₹1320.20 (red lines)
Next Possible Support: ₹1132.20 and ₹1114.85 (green lines, if reversal happens later)
📊 Volume Analysis:
Heavy spike in volume confirming strong buying activity.
🧠 Observational Bias:
As long as the price stays above ₹1300.90, the momentum remains bullish.
Small dips toward support can be seen as healthy pullbacks.
📅 Date: April 28, 2025
📈 Timeframe: Daily Chart
🔍 Stock: Reliance Industries Ltd (NSE)
📌 Technical Overview:
Reliance Industries has shown strong bullish momentum after breaking out above the important level of ₹1300.90.
Several indicators are supporting this breakout:
✅ RSI Breakout – Showing strong strength.
✅ Bollinger Bands Breakout – Price is breaking outside the bands, showing heavy momentum.
✅ Bullish VWAP Trend – Price is trading well above the VWAP line.
✅ TTM Squeeze Breakout – Major squeeze breakout confirms buyers' control.
🧩 Key Levels:
Major Resistance Broken: ₹1300.90 ✅
Immediate Support Now: ₹1329.95 and ₹1320.20 (red lines)
Next Possible Support: ₹1132.20 and ₹1114.85 (green lines, if reversal happens later)
📊 Volume Analysis:
Heavy spike in volume confirming strong buying activity.
🧠 Observational Bias:
As long as the price stays above ₹1300.90, the momentum remains bullish.
Small dips toward support can be seen as healthy pullbacks.
📊 STWP | Mentor | Demand & Supply Specialist
🎯 Helping you become a self-reliant & independent trader
🎓 Learn more: simpletradewithpatience.com
📲 WhatsApp: wa.me/919987567889
🔍 Trade with Clarity. Learn with Patience.
🎯 Helping you become a self-reliant & independent trader
🎓 Learn more: simpletradewithpatience.com
📲 WhatsApp: wa.me/919987567889
🔍 Trade with Clarity. Learn with Patience.
คำจำกัดสิทธิ์ความรับผิดชอบ
ข้อมูลและบทความไม่ได้มีวัตถุประสงค์เพื่อก่อให้เกิดกิจกรรมทางการเงิน, การลงทุน, การซื้อขาย, ข้อเสนอแนะ หรือคำแนะนำประเภทอื่น ๆ ที่ให้หรือรับรองโดย TradingView อ่านเพิ่มเติมที่ ข้อกำหนดการใช้งาน