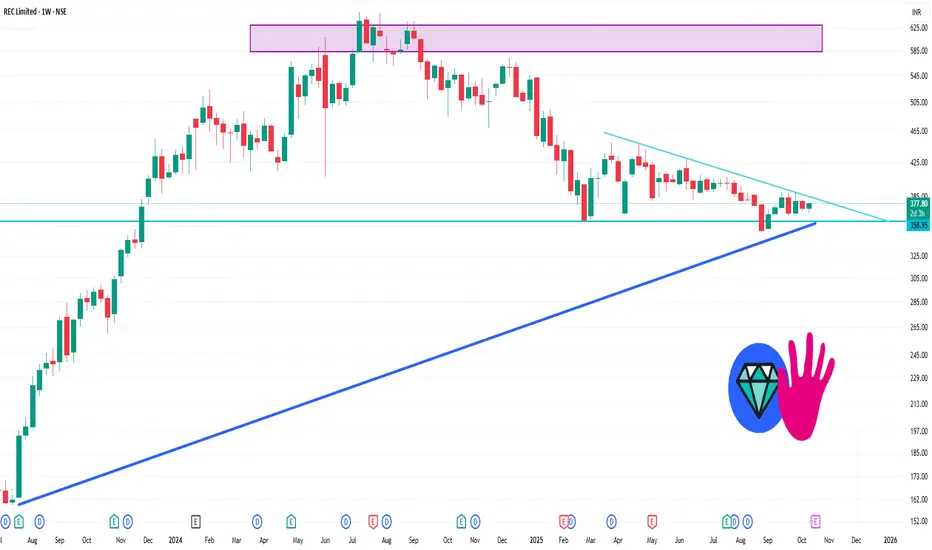
📊 Weekly Support & Resistance Levels
Immediate Support: ₹367.92
Key Support: ₹362.88
Immediate Resistance: ₹379.97
Key Resistance: ₹386.98
Weekly Trading Range: ₹355.87 – ₹392.02
🔍 Technical Indicators
RSI (14-day): 50.58 — Indicates a neutral momentum
MACD: -1.16 — Suggests a bearish trend
ADX: 15.79 — Indicates a weak trend
Stochastic RSI: 27.40 — Indicates an oversold condition
Moving Averages: Both short-term and long-term moving averages are neutral, with no clear buy or sell signals.
📈 Trend Analysis
Short-Term Trend: Neutral
Mid-Term Trend: Bearish
Long-Term Trend: Bearish
Resistance Levels: ₹386.7 (short-term), ₹391.55 (mid-term), ₹446.25 (long-term)
Support Levels: ₹364.3 (short-term), ₹350 (mid-term), ₹350 (long-term)
การนำเสนอที่เกี่ยวข้อง
คำจำกัดสิทธิ์ความรับผิดชอบ
ข้อมูลและบทความไม่ได้มีวัตถุประสงค์เพื่อก่อให้เกิดกิจกรรมทางการเงิน, การลงทุน, การซื้อขาย, ข้อเสนอแนะ หรือคำแนะนำประเภทอื่น ๆ ที่ให้หรือรับรองโดย TradingView อ่านเพิ่มเติมใน ข้อกำหนดการใช้งาน
การนำเสนอที่เกี่ยวข้อง
คำจำกัดสิทธิ์ความรับผิดชอบ
ข้อมูลและบทความไม่ได้มีวัตถุประสงค์เพื่อก่อให้เกิดกิจกรรมทางการเงิน, การลงทุน, การซื้อขาย, ข้อเสนอแนะ หรือคำแนะนำประเภทอื่น ๆ ที่ให้หรือรับรองโดย TradingView อ่านเพิ่มเติมใน ข้อกำหนดการใช้งาน