📉Technical View:
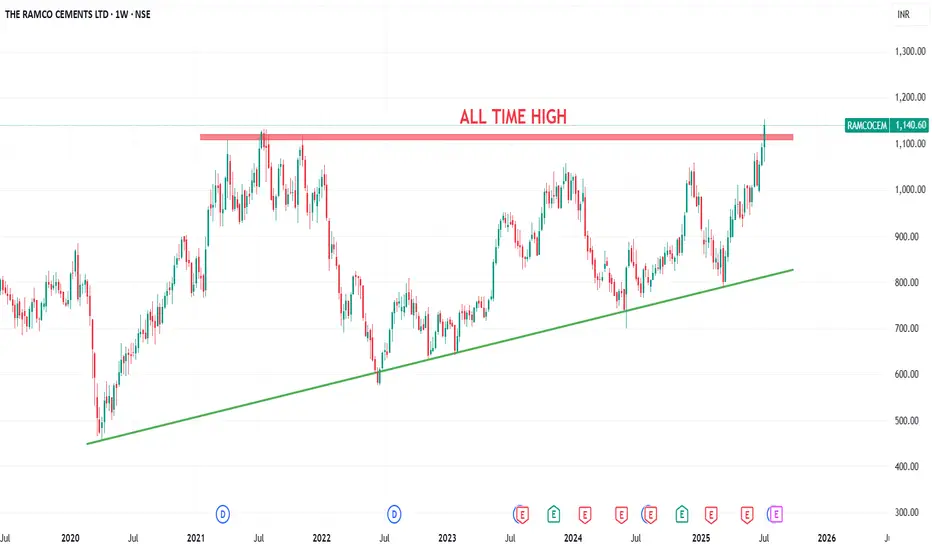
Ramco Cement Limited has formed a beautiful ascending triangle pattern with a strong resistance zone at ₹1080–₹1130, tested since 2021. Today, it broke out and hit a new all-time high of ₹1152, now hovering around ₹1140.
If the breakout holds, we may see:
🎯Target 1: ₹1200
🎯Target 2: ₹1240
🎯Target 3: ₹1300
If the stock falls back below ₹1030, the breakout becomes invalid.
💰Q4 FY24 Financial Highlights (vs Q3 FY24 & Q4 FY23)
📈Fundamentals & Dividend Insights:
✅ Company continues with capacity expansion in East & South India.
✅ Focus on green energy & cost optimization to improve margin outlook.
💸 Dividend Declared (May 2025): ₹3.50 per share
📝Final Word:
The breakout on charts is significant and supported by top-line improvement. If sustained, the stock may offer strong upside potential, making Ramco Cement one to watch closely.
Ramco Cement Limited has formed a beautiful ascending triangle pattern with a strong resistance zone at ₹1080–₹1130, tested since 2021. Today, it broke out and hit a new all-time high of ₹1152, now hovering around ₹1140.
If the breakout holds, we may see:
🎯Target 1: ₹1200
🎯Target 2: ₹1240
🎯Target 3: ₹1300
If the stock falls back below ₹1030, the breakout becomes invalid.
💰Q4 FY24 Financial Highlights (vs Q3 FY24 & Q4 FY23)
- Total Income: ₹2397 Cr (↑+21% vs ₹1983 Cr; ↓–10% vs ₹2678 Cr)
- Total Expenses: ₹2078 Cr (↑+93% vs ₹1074 Cr; ↓–8% vs ₹2259 Cr)
- Operating Profits: ₹319 Cr (↑+14% vs ₹279 Cr; ↓–24% vs ₹419 Cr)
- Profit Before Tax: ₹46 Cr (↓–76% vs ₹191 Cr; ↓–74% vs ₹175 Cr)
- Profit After Tax: ₹26 Cr (↓–86% vs ₹182 Cr; ↓–80% vs ₹129 Cr)
- Diluted EPS: ₹1.16 (↓–85% vs ₹7.72; ↓–79% vs ₹5.46)
📈Fundamentals & Dividend Insights:
✅ Company continues with capacity expansion in East & South India.
✅ Focus on green energy & cost optimization to improve margin outlook.
💸 Dividend Declared (May 2025): ₹3.50 per share
📝Final Word:
The breakout on charts is significant and supported by top-line improvement. If sustained, the stock may offer strong upside potential, making Ramco Cement one to watch closely.
คำจำกัดสิทธิ์ความรับผิดชอบ
ข้อมูลและบทความไม่ได้มีวัตถุประสงค์เพื่อก่อให้เกิดกิจกรรมทางการเงิน, การลงทุน, การซื้อขาย, ข้อเสนอแนะ หรือคำแนะนำประเภทอื่น ๆ ที่ให้หรือรับรองโดย TradingView อ่านเพิ่มเติมที่ ข้อกำหนดการใช้งาน
คำจำกัดสิทธิ์ความรับผิดชอบ
ข้อมูลและบทความไม่ได้มีวัตถุประสงค์เพื่อก่อให้เกิดกิจกรรมทางการเงิน, การลงทุน, การซื้อขาย, ข้อเสนอแนะ หรือคำแนะนำประเภทอื่น ๆ ที่ให้หรือรับรองโดย TradingView อ่านเพิ่มเติมที่ ข้อกำหนดการใช้งาน