Signals Fresh Uptrend After Months of Consolidation
Price Action:
-
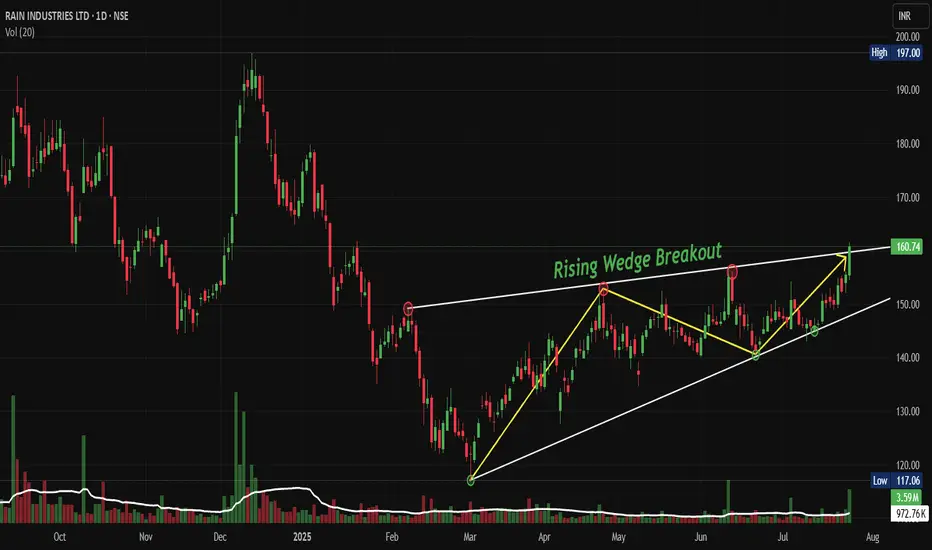
- The stock has recently broken out above the upper trendline of the wedge at approximately 160 levels
- Current price of 160.74 represents a significant move above the key resistance zone
- The breakout is accompanied by increased volume, suggesting genuine buying interest
Volume Spread Analysis:
• Volume breakout accompanied the wedge pattern breakout
• Higher volumes during up moves compared to down moves indicate bullish participation
• Volume spike visible during the recent breakout at 160+ levels
• Average volume of 972K around today, 3.59M shares with recent surge to higher levels
Base Formation and Accumulation Zone:
• The stock established a strong base between 117-125 levels from March to July 2025
• Multiple retests of the 117 support level showed strong buying interest
• Base formation lasted approximately 4 months, indicating thorough accumulation
• Volume during base formation remained relatively stable with occasional spikes
Key Support and Resistance Levels:
• Primary Support: 117.06 (marked as swing low and base support)
• Secondary Support: 140-145 zone (previous resistance turned support)
• Immediate Resistance: 165-170 zone (next major hurdle)
• Target Resistance: 180-185 zone (measured move target)
• 52-week High: 197.00 (ultimate resistance level)
Technical Patterns:
Rising Wedge Breakout Pattern:
• Clear rising wedge pattern formed over 4-5 months
• Lower highs and higher lows converged into a wedge formation
• Breakout occurred at 160+ levels with strong volume confirmation
• Pattern suggests continuation of the broader uptrend
Trend Analysis:
• Long-term trend: Bullish (higher highs and higher lows since March 2025)
• Medium-term trend: Bullish breakout from consolidation
• Short-term trend: Strong bullish momentum post-breakout
• Moving averages alignment suggests sustained upward momentum
Chart Patterns and Indicators:
• Cup and handle formation visible in the broader timeframe
• Multiple flag patterns during the consolidation phase
• Price above all key moving averages, indicating bullish sentiment
Trade Setup and Strategy:
Entry Levels:
• Aggressive Entry: 155-160 levels (on any minor pullback)
• Conservative Entry: 145-150 levels (on deeper retracement to support)
• Breakout Entry: Above 165 levels with volume confirmation
• averaging between 150-160 for position building
Exit Levels and Targets:
• Target 1: 180-185 levels (initial profit booking - 15-20% upside)
• Target 2: 195-200 levels (testing previous highs - 25-30% upside)
• Target 3: 220-230 levels (extended target - 40-45% upside)
• Swing high exit: Trail stops below key support levels
Stop-Loss Strategy:
• Initial Stop-Loss: Below 140 levels (10-12% risk from current levels)
• Trailing Stop-Loss: Below 150 levels once 180 is achieved
• Pattern Stop-Loss: Below the wedge support around 145 levels
• Time-based stop: Exit if no progress in 2-3 months
Position Sizing and Risk Management:
• Maximum position size: 2-3% of total portfolio
• Risk per trade: Not more than 1% of portfolio value
• Scale in approach: 50% at entry, 30% on dip, 20% on breakout confirmation
• Maintain a risk-reward ratio of a minimum of 1:3
Sectoral and Fundamental Backdrop:
Company Overview:
•
• Market Cap: 5,405 Crore with Revenue: 15,472 Cr
• Promoter Holding: 41.2% indicating stable management control
Financial Health Assessment:
• The company has a low interest coverage ratio, which poses some financial risk
• Net Profit: ₹-115.10Cr as on March 2025 (Q4 FY25) showing current losses
• The company has delivered a poor sales growth of 4.46% over the past five years
• Recent debt reduction efforts as management focuses on prepaying obligations
Business Segments Performance:
• Carbon Business: Environment-friendly and energy-efficient practices have made RAIN's carbon business highly profitable and sustainable
• The carbon business co-generates energy at six calcined petroleum coke plants with a combined power-generation capacity of approximately 135 MW
• The speciality chemicals segment is showing resilience despite market challenges
Sector Outlook and Industry Trends:
• In 2025, the industry is expected to continue its recovery, adjusting to new market drivers while balancing short- and long-term goals
• Chemical industry focusing on decarbonization and innovation initiatives
• India Ratings affirms Rain Industries' credit rating at IND A/Stable with stable outlook and improved operational outlook
Key Risk Factors:
• Cyclical nature of the chemical industry affecting margins
• High debt levels and interest coverage concerns
• Global economic slowdown has an impact on demand
• Raw material price volatility
• Environmental regulations affecting operations
Positive Catalysts
• Debt reduction strategy showing management commitment
• Stable credit rating with improved operational outlook
• Strong technical breakout indicating renewed investor interest
• Global chemical industry recovery supporting sector sentiment
• Energy co-generation capabilities providing cost advantages
Risk Assessment and Monitoring:
Key Levels to Watch:
• Break below 145: Bearish signal, consider exit
• Sustain above 165: Bullish confirmation for higher targets
• Volume patterns: Declining volume on up moves would be concerning
• Sector rotation: Monitor chemical sector performance relative to the broader market
Regular Review Parameters:
• Weekly closing above key moving averages
• Monthly volume trends and institutional participation
• Quarterly earnings performance and guidance
• Industry developments and regulatory changes
• Management commentary on debt reduction progress
Exit Triggers:
• Fundamental deterioration in business metrics
• Break of key technical support levels
• Adverse sector developments
• Better opportunities in other stocks/sectors
• Achievement of target levels with profit booking
My Take:
Keep in the Watchlist and DOYR.
NO RECO. For Buy/Sell.
📌Thank you for exploring my idea! I hope you found it valuable.
🙏FOLLOW for more
👍BOOST if you found it useful.
✍️COMMENT below with your views.
Meanwhile, check out my other stock ideas on the right side until this trade is activated. I would love your feedback.
Disclaimer: "I am not a SEBI REGISTERED RESEARCH ANALYST AND INVESTMENT ADVISER."
This analysis is intended solely for informational and educational purposes and should not be interpreted as financial advice. It is advisable to consult a qualified financial advisor or conduct thorough research before making investment decisions.
การนำเสนอที่เกี่ยวข้อง
คำจำกัดสิทธิ์ความรับผิดชอบ
ข้อมูลและบทความไม่ได้มีวัตถุประสงค์เพื่อก่อให้เกิดกิจกรรมทางการเงิน, การลงทุน, การซื้อขาย, ข้อเสนอแนะ หรือคำแนะนำประเภทอื่น ๆ ที่ให้หรือรับรองโดย TradingView อ่านเพิ่มเติมใน ข้อกำหนดการใช้งาน
การนำเสนอที่เกี่ยวข้อง
คำจำกัดสิทธิ์ความรับผิดชอบ
ข้อมูลและบทความไม่ได้มีวัตถุประสงค์เพื่อก่อให้เกิดกิจกรรมทางการเงิน, การลงทุน, การซื้อขาย, ข้อเสนอแนะ หรือคำแนะนำประเภทอื่น ๆ ที่ให้หรือรับรองโดย TradingView อ่านเพิ่มเติมใน ข้อกำหนดการใช้งาน