QuantumScape’s Cobra Milestone Ignites Hype — But Looming Dilution and Scaling Risks Could Stall the Rally
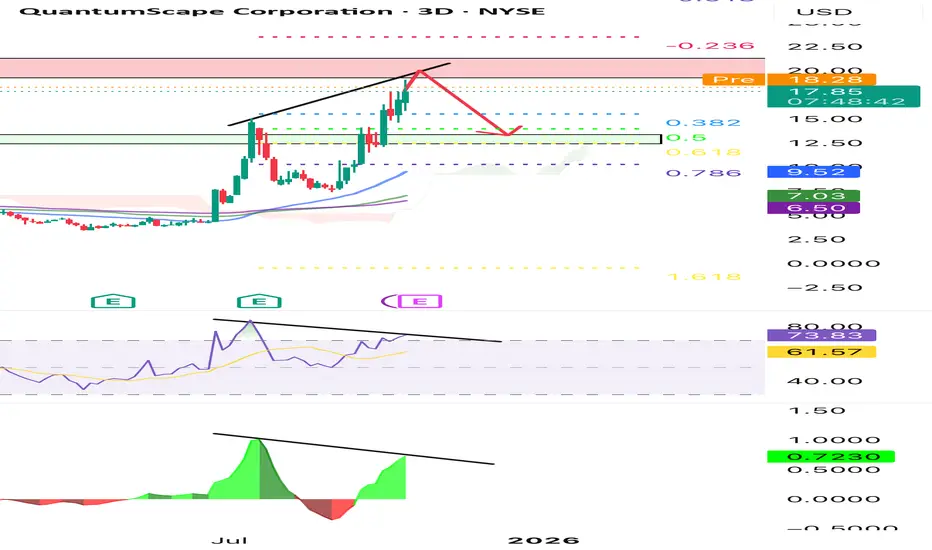
QuantumScape is testing a key resistance zone between $18–$20, where price action shows clear signs of momentum weakening. Both the RSI and MACD histogram display bearish divergence, signaling a potential exhaustion of the current rally as price prints higher highs while momentum forms lower highs.
The Fibonacci retracement levels highlight strong support near the 0.5–0.618 zone ($13.5–$11), aligning with the previous consolidation range and the cloud base area. A correction toward this zone would represent a healthy retest of broken structure and offer a potential re-accumulation point.
As long as price fails to close decisively above $20, the probability favors a pullback toward $14–$12, before any continuation of the broader uptrend.
คำจำกัดสิทธิ์ความรับผิดชอบ
ข้อมูลและบทความไม่ได้มีวัตถุประสงค์เพื่อก่อให้เกิดกิจกรรมทางการเงิน, การลงทุน, การซื้อขาย, ข้อเสนอแนะ หรือคำแนะนำประเภทอื่น ๆ ที่ให้หรือรับรองโดย TradingView อ่านเพิ่มเติมที่ ข้อกำหนดการใช้งาน
คำจำกัดสิทธิ์ความรับผิดชอบ
ข้อมูลและบทความไม่ได้มีวัตถุประสงค์เพื่อก่อให้เกิดกิจกรรมทางการเงิน, การลงทุน, การซื้อขาย, ข้อเสนอแนะ หรือคำแนะนำประเภทอื่น ๆ ที่ให้หรือรับรองโดย TradingView อ่านเพิ่มเติมที่ ข้อกำหนดการใช้งาน