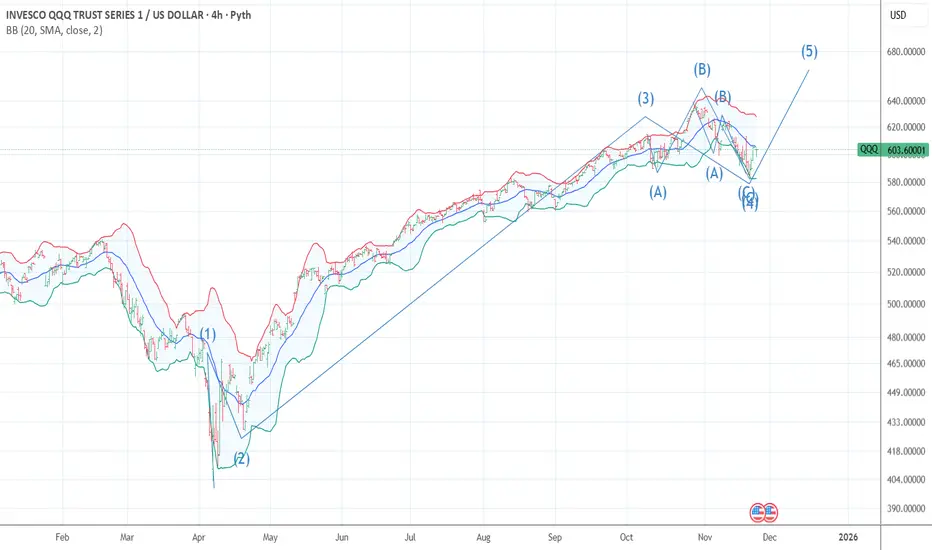
The chart posted below is my Alt bullish wave structure we can count it two ways first it was a simple zig zag down from 639 to 580 a 9.3 % decline and an ABC flat also 9.3 % decline I will look for a 14.3 % rally off the low of 580 zone It should take about 15 TD to form the Blowoff top based on Put /call models and NASI forming support in the minus -500 zone over the last 5 years . and the HIGH QQQ VIX VXN . I have moved back again into a position long calls mid year 2027 Only as we are at downtrend lines in qqqe qqqj and rsp as of this post I alos have major support in IGV now
คำจำกัดสิทธิ์ความรับผิดชอบ
ข้อมูลและบทความไม่ได้มีวัตถุประสงค์เพื่อก่อให้เกิดกิจกรรมทางการเงิน, การลงทุน, การซื้อขาย, ข้อเสนอแนะ หรือคำแนะนำประเภทอื่น ๆ ที่ให้หรือรับรองโดย TradingView อ่านเพิ่มเติมใน ข้อกำหนดการใช้งาน
คำจำกัดสิทธิ์ความรับผิดชอบ
ข้อมูลและบทความไม่ได้มีวัตถุประสงค์เพื่อก่อให้เกิดกิจกรรมทางการเงิน, การลงทุน, การซื้อขาย, ข้อเสนอแนะ หรือคำแนะนำประเภทอื่น ๆ ที่ให้หรือรับรองโดย TradingView อ่านเพิ่มเติมใน ข้อกำหนดการใช้งาน