Symmetrical triangle = compression where buyers keep stepping in higher, but sellers cap at lower levels
In a proper symmetrical triangle, volume should decline as the pattern compresses
Volume must expand; otherwise it’s just a fake-out; ideally, RSI also breaks under ~40 & MACD diverges down
Watch the first 15–30 min of volume after the break
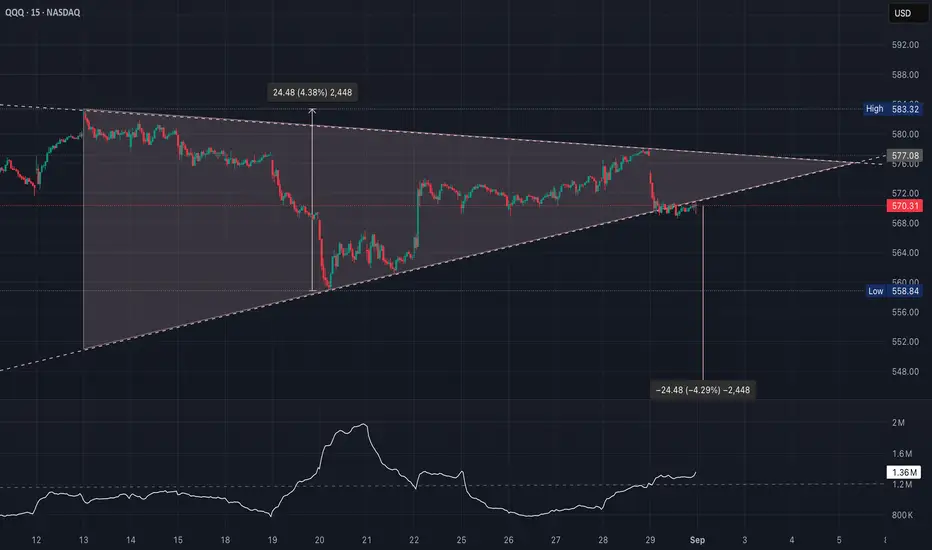
Price broke down through the ascending support trendline around ~$572, currently testing $570
Bulls need a fast reclaim of $572–$573 on strong volume; otherwise, bears keep control
- Often a continuation pattern, but it can break either way depending on volume + macro drivers
- MACD just had a bearish cross earlier, but it’s trying to curl back up which suggests indecision & matches the triangle
- RSI is holding mid-zone (~45) - not oversold, not overbought, again, neutral compression
In a proper symmetrical triangle, volume should decline as the pattern compresses
- This shows traders waiting, fewer willing to commit inside the chop
- That looks normal here (quieter trading into late August)
Volume must expand; otherwise it’s just a fake-out; ideally, RSI also breaks under ~40 & MACD diverges down
- If price falls back inside the triangle on weak volume, it’s a false move
- If price reclaims the ascending line quickly, it’s a bear trap
- If the breakout candle volume is ≥150% of average, that’s confirmation
- If price moves but volume stays weak, expect a possible reversal
Watch the first 15–30 min of volume after the break
- If it’s a strong surge, odds favor continuation
- If volume fades and price chops back inside the triangle, it’s likely a fake-out
Price broke down through the ascending support trendline around ~$572, currently testing $570
- Volume expanded on the breakdown candle which adds credibility to the move
- If follow-through comes with continued above-average volume, it confirms the downside break
- Triangle height is ~24 points (from ~$583 high to ~$559 low), so $570 – $24 = ~$546 (aligns with prior support from mid-August)
- If volume continues to stay above 1.3M baseline & Tuesday closes weak, expect sellers to aim for ~$558 first (previous swing low) & then the measured move (~$546)
- Direction = which line breaks (up/down)
- Strength = whether volume surges beyond normal
Bulls need a fast reclaim of $572–$573 on strong volume; otherwise, bears keep control
I am not a licensed professional & these posts are for informational purposes only, not financial advice.
คำจำกัดสิทธิ์ความรับผิดชอบ
ข้อมูลและบทความไม่ได้มีวัตถุประสงค์เพื่อก่อให้เกิดกิจกรรมทางการเงิน, การลงทุน, การซื้อขาย, ข้อเสนอแนะ หรือคำแนะนำประเภทอื่น ๆ ที่ให้หรือรับรองโดย TradingView อ่านเพิ่มเติมใน ข้อกำหนดการใช้งาน