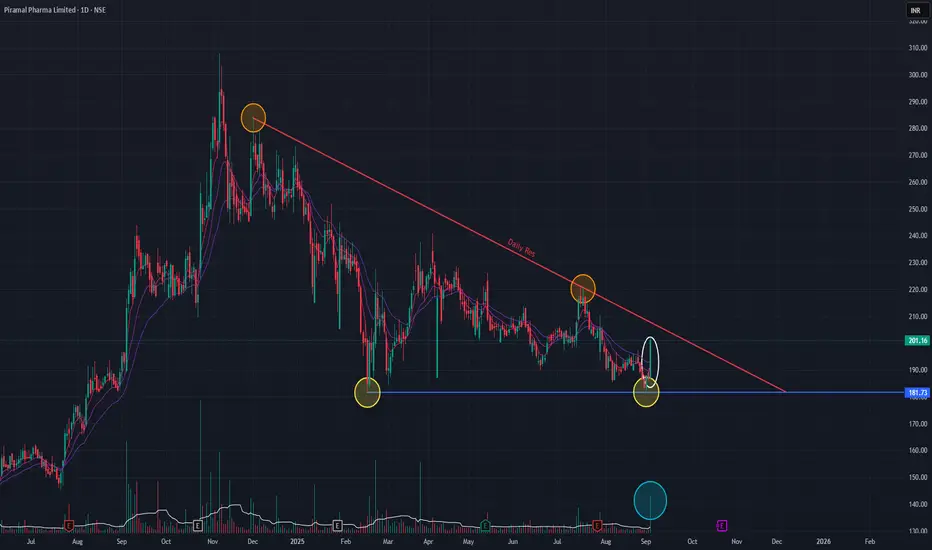
Piramal Pharma, has formed a Double-Bottom chart pattern, indicating Bullish reversal. With today's bullish candle the volume has also spiked. We should watch out for the price action in the coming days. As indicated in the chart, resistance trendline is respected as well as the support trendline. If the stock has to move up, then it has to breach the resistance trendline.
Let's keep a watch on it.
Let's keep a watch on it.
Disclaimer: This analysis is my personal view & for educational purposes only. They shall not be construed as trade or investment advice. Before making any financial decision, it is imperative that you consult with a qualified financial professional.
คำจำกัดสิทธิ์ความรับผิดชอบ
ข้อมูลและบทความไม่ได้มีวัตถุประสงค์เพื่อก่อให้เกิดกิจกรรมทางการเงิน, การลงทุน, การซื้อขาย, ข้อเสนอแนะ หรือคำแนะนำประเภทอื่น ๆ ที่ให้หรือรับรองโดย TradingView อ่านเพิ่มเติมใน ข้อกำหนดการใช้งาน