📊 Key levels & structure
Based on current weekly chart readings, recent pivot data and visible support/resistance zones:
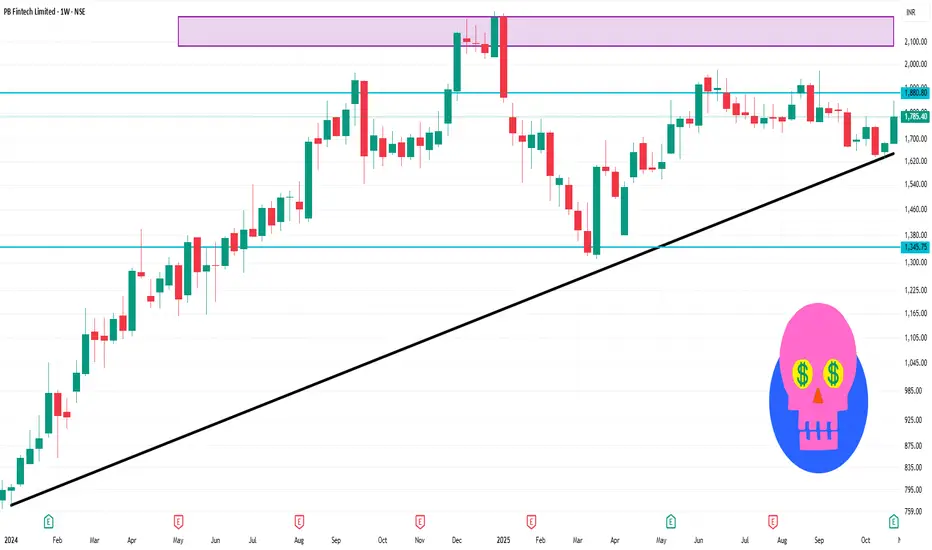
Resistance zone: ~ ₹1,775-1,825 — price has been tested around this area, acting as a cap.
Support zone: ~ ₹1,650-1,620 — key lower bounds that have held in recent pullbacks.
Intermediate pivot / trigger area: ~ ₹1,700-₹1,740 — if this area gives way, next leg down could accelerate; if it holds, potential bounce.
Weekly trend: The stock is below its 50- and 200-week moving averages, signalling caution for bulls.
Momentum: RSI in mid‐range, ADX weak, so trend strength is moderate.
Based on current weekly chart readings, recent pivot data and visible support/resistance zones:
Resistance zone: ~ ₹1,775-1,825 — price has been tested around this area, acting as a cap.
Support zone: ~ ₹1,650-1,620 — key lower bounds that have held in recent pullbacks.
Intermediate pivot / trigger area: ~ ₹1,700-₹1,740 — if this area gives way, next leg down could accelerate; if it holds, potential bounce.
Weekly trend: The stock is below its 50- and 200-week moving averages, signalling caution for bulls.
Momentum: RSI in mid‐range, ADX weak, so trend strength is moderate.
การนำเสนอที่เกี่ยวข้อง
คำจำกัดสิทธิ์ความรับผิดชอบ
ข้อมูลและบทความไม่ได้มีวัตถุประสงค์เพื่อก่อให้เกิดกิจกรรมทางการเงิน, การลงทุน, การซื้อขาย, ข้อเสนอแนะ หรือคำแนะนำประเภทอื่น ๆ ที่ให้หรือรับรองโดย TradingView อ่านเพิ่มเติมใน ข้อกำหนดการใช้งาน
การนำเสนอที่เกี่ยวข้อง
คำจำกัดสิทธิ์ความรับผิดชอบ
ข้อมูลและบทความไม่ได้มีวัตถุประสงค์เพื่อก่อให้เกิดกิจกรรมทางการเงิน, การลงทุน, การซื้อขาย, ข้อเสนอแนะ หรือคำแนะนำประเภทอื่น ๆ ที่ให้หรือรับรองโดย TradingView อ่านเพิ่มเติมใน ข้อกำหนดการใช้งาน