🔍 PNB
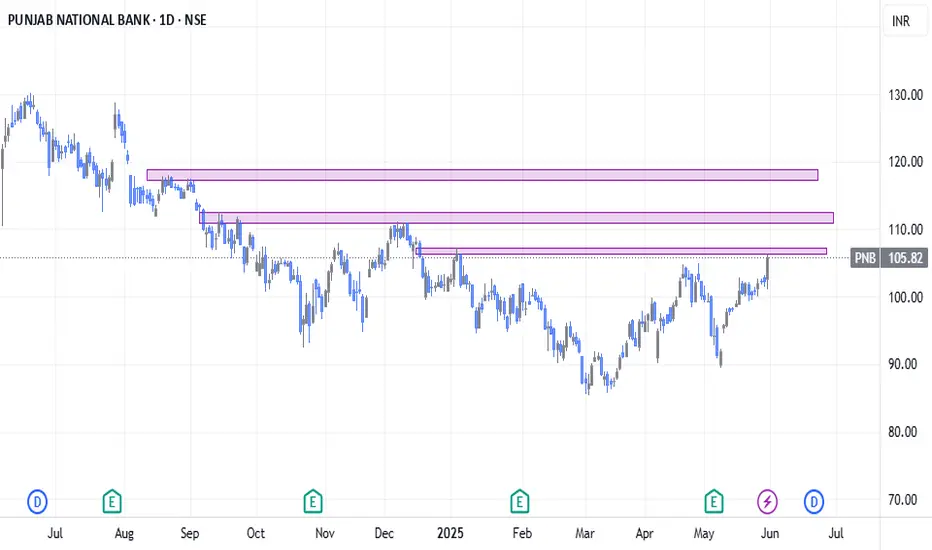
✅ Daily Chart:
PNB took support at the 200-day MA, forming a strong bullish candle — clear sign of buyer strength at a key level.
✅ Weekly Chart:
The stock closed above the 50-week MA, indicating momentum building on a higher timeframe.
🧱 Resistance Zone Ahead – ₹107.20 to ₹112:
Price is nearing a supply zone. Sustaining above ₹107.40 with volume would indicate strength and continuation.
📌 What to Watch:
🔼 Buy Trigger:
Only consider a potential move if price sustains above ₹107.40 with strong momentum and volume confirmation.
💡 Conclusion:
PNB is showing strength with a bullish structure — holding 200 MA on daily and crossing 50 MA on weekly. Focus remains on price action near ₹107.40 for further movement.
📊 Refer to the zones marked in the above chart for better clarity.
⚠️ Disclaimer: This is purely for educational purposes. Not financial advice. Please consult your advisor before making any trading decisions.
ปิดการเทรด: ถึงเป้าหมายการทำกำไร
คำจำกัดสิทธิ์ความรับผิดชอบ
ข้อมูลและบทความไม่ได้มีวัตถุประสงค์เพื่อก่อให้เกิดกิจกรรมทางการเงิน, การลงทุน, การซื้อขาย, ข้อเสนอแนะ หรือคำแนะนำประเภทอื่น ๆ ที่ให้หรือรับรองโดย TradingView อ่านเพิ่มเติมที่ ข้อกำหนดการใช้งาน
คำจำกัดสิทธิ์ความรับผิดชอบ
ข้อมูลและบทความไม่ได้มีวัตถุประสงค์เพื่อก่อให้เกิดกิจกรรมทางการเงิน, การลงทุน, การซื้อขาย, ข้อเสนอแนะ หรือคำแนะนำประเภทอื่น ๆ ที่ให้หรือรับรองโดย TradingView อ่านเพิ่มเติมที่ ข้อกำหนดการใช้งาน