1️⃣ Trend & Structure
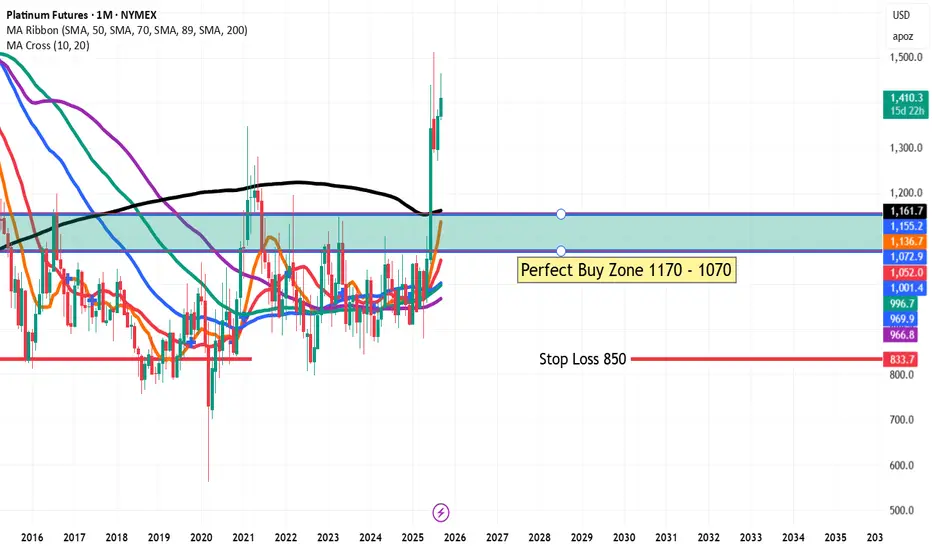
Long-Term Breakout: After years of sideways consolidation between roughly $850–$1,200, Platinum has broken above the long-term moving averages (MA ribbon and 200-month black MA), signaling a strong structural breakout.
Momentum Shift: The recent monthly candles show strong bullish follow-through, indicating renewed institutional interest.
2️⃣ Key Price Zones
Perfect Buy Zone: $1,170 – $1,070
Highlighted in yellow, this area represents a strong historical demand/support zone and an ideal pullback entry for swing or position traders.
First Target: $1,643 – $1,692
Marked in purple, this is the next major resistance cluster where price may encounter selling pressure or consolidate.
3️⃣ Support & Stop Loss
Primary Support: The breakout area around $1,150 – $1,170 now acts as the first layer of support.
Defensive Stop: The chart suggests a wider stop loss around $850, which is below the long-term base and protects against a full breakdown of the bullish setup.
4️⃣ Moving Averages & Indicators
MA Ribbon Alignment: Short- to mid-term moving averages (20, 50, 70, 89) have turned upward and are stacking bullishly above the 200-month MA, which is a classic long-term buy signal.
Volume (not shown): Sustained volume on the breakout would further confirm institutional buying.
5️⃣ Trading Scenarios
Bullish Base Case:
A pullback toward $1,170 – $1,070 offers a favorable risk–reward entry for a run toward $1,643 – $1,692.
A monthly close above $1,700 would open the door for extended gains toward the psychological $1,900–$2,000 zone.
Bearish Risk:
A decisive close below $1,070 would weaken the breakout thesis.
A drop below $850 invalidates the bullish structure entirely.
📊 Summary
Platinum Futures have shifted from a multi-year consolidation to a confirmed long-term bullish trend. The breakout above key moving averages strengthens the technical case for upside toward the $1,650 area, with a preferred accumulation zone on any retracement to $1,170–$1,070 and a protective stop near $850.
คำจำกัดสิทธิ์ความรับผิดชอบ
ข้อมูลและบทความไม่ได้มีวัตถุประสงค์เพื่อก่อให้เกิดกิจกรรมทางการเงิน, การลงทุน, การซื้อขาย, ข้อเสนอแนะ หรือคำแนะนำประเภทอื่น ๆ ที่ให้หรือรับรองโดย TradingView อ่านเพิ่มเติมที่ ข้อกำหนดการใช้งาน
คำจำกัดสิทธิ์ความรับผิดชอบ
ข้อมูลและบทความไม่ได้มีวัตถุประสงค์เพื่อก่อให้เกิดกิจกรรมทางการเงิน, การลงทุน, การซื้อขาย, ข้อเสนอแนะ หรือคำแนะนำประเภทอื่น ๆ ที่ให้หรือรับรองโดย TradingView อ่านเพิ่มเติมที่ ข้อกำหนดการใช้งาน