Pi Coin (PI) is holding near $0.208, down almost 1% in the past 24 hours and more than 53% in three months. Retail buyers are trying to hold the line, but chart signals suggest more downside ahead.
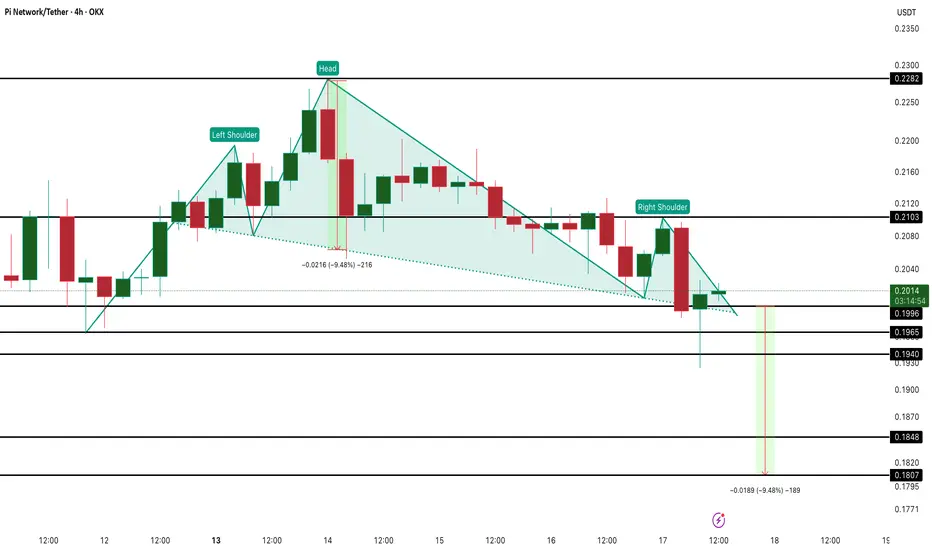
On the 4-hour chart, Pi Coin is forming a head-and-shoulders pattern, a setup that often signals a breakdown inside a broader downtrend. The neckline sits around $0.199, and a fall below $0.196 could trigger a 9.5% drop toward $0.180.
The Money Flow Index (MFI) shows retail inflows improving slightly, forming a small bullish divergence — meaning dip-buying continues. But the Relative Strength Index (RSI) tells a different story. Between October 6 and 13, RSI made a higher high while price made a lower high, forming a hidden bearish divergence that points to fading momentum.
The Chaikin Money Flow (CMF) also remains under zero, showing weak large-wallet interest. For bulls to regain control, Pi must close above $0.210 — and a true reversal would need a breakout past $0.228. Until then, the pressure under $0.19 keeps the risk tilted to the downside.
Leader in crypto news, award winning journalism in 26 languages.
คำจำกัดสิทธิ์ความรับผิดชอบ
ข้อมูลและบทความไม่ได้มีวัตถุประสงค์เพื่อก่อให้เกิดกิจกรรมทางการเงิน, การลงทุน, การซื้อขาย, ข้อเสนอแนะ หรือคำแนะนำประเภทอื่น ๆ ที่ให้หรือรับรองโดย TradingView อ่านเพิ่มเติมใน ข้อกำหนดการใช้งาน
Leader in crypto news, award winning journalism in 26 languages.
คำจำกัดสิทธิ์ความรับผิดชอบ
ข้อมูลและบทความไม่ได้มีวัตถุประสงค์เพื่อก่อให้เกิดกิจกรรมทางการเงิน, การลงทุน, การซื้อขาย, ข้อเสนอแนะ หรือคำแนะนำประเภทอื่น ๆ ที่ให้หรือรับรองโดย TradingView อ่านเพิ่มเติมใน ข้อกำหนดการใช้งาน