### Market Structure & Context
PepsiCo has demonstrated a robust uptrend architecture spanning May through September, establishing a clear sequence of higher highs and higher lows. The current retracement presents a textbook opportunity as price revisits a proven demand zone where institutional buyers previously stepped in with conviction.
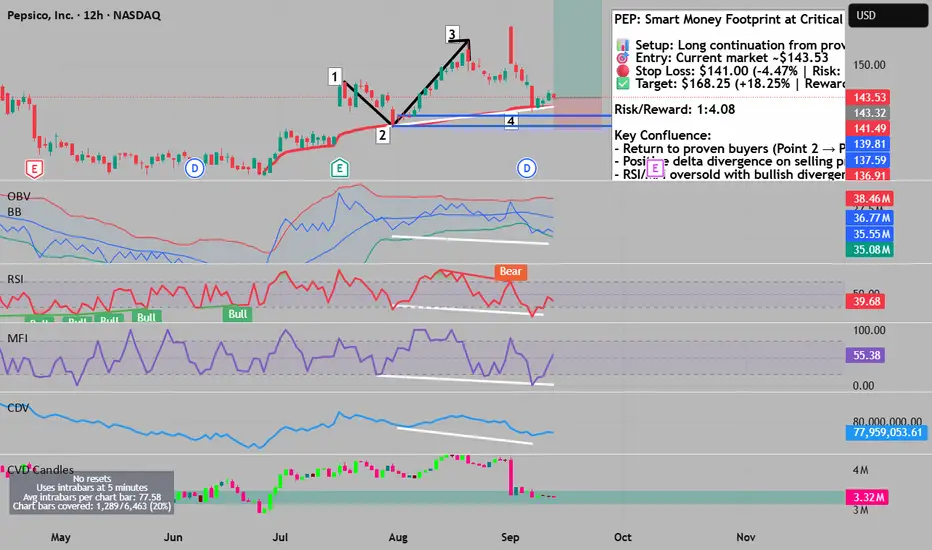
The numbered wave structure reveals critical market psychology:
- Point 1 → 3: Breakout confirmation with close above initial resistance
- Point 2: Established as verified institutional accumulation zone
- Point 3 → 4: Natural retracement returning to test proven buyers
### Volume Footprint Intelligence
The granular footprint analysis exposes sophisticated accumulation patterns invisible on traditional charts:
Monday Sept 8: Despite aggressive selling with multiple imbalances, price rejected and closed above a buying imbalance zone. The positive delta on a bearish bar signals hidden institutional absorption of retail selling.
Tuesday Sept 9: Three stacked bullish imbalances formed while price pushed lower—classic absorption pattern. Negative delta divergence confirms smart money accumulating into weakness.
Wednesday Sept 10: Clean bullish close above imbalance with supporting positive delta—accumulation phase transitioning to markup.
Thursday Sept 11: Price conquered the value area high/low of previous three sessions with dual bullish imbalances and positive delta confirmation.
### Multi-Timeframe Oscillator Divergences
The technical mosaic presents compelling bullish divergences across multiple indicators:
- RSI & MFI: Both oscillators display oversold conditions at Point 4 while price forms a higher high versus Point 2—textbook positive divergence
- OBV: Piercing the lower Bollinger Band deviation signals exhausted selling pressure
- CDV: Price returned to pre-discovery consolidation zone—historically a high-probability reversal area
### Anchored VWAP Confluence
The anchored VWAP from the momentum initiation point provides dynamic support precisely at Points 2 and 4, confirming this level as algorithmically significant for institutional participants.
### Risk Management Framework
Entry Zone: $143.53 (current market price)
Stop Loss: $141.00 (-4.47% from entry | Risk: $750 per contract)
Take Profit: $168.25 (+18.25% from entry | Reward: $2,616 per contract)
Risk/Reward Ratio: 1:4.08 — exceptional asymmetric opportunity
Position Sizing: With a 4.08:1 reward-to-risk ratio, this setup offers substantial upside with controlled downside. Size position according to account risk tolerance (1-2% max risk recommended).
### Trade Execution Strategy
Entry Tactics:
- Primary entry at current levels ~$143.53
- Scale-in opportunity on any dip toward $142.50
- Confirmation entry on break above $144.50
Exit Strategy:
- Initial Target: $150.00 (psychological level) — consider taking 25% profits
- Secondary Target: $157.00 (halfway point) — reduce another 25%
- Final Target: $168.25 — exit remaining position or trail stop for continuation
Stop Management:
- Initial stop at $141.00 (below Point 2 support)
- Trail to breakeven once price reaches $150.00
- Trail to $145.00 when price hits $157.00
### Probability Assessment
This setup combines multiple high-conviction factors:
✅ Trend alignment (5-month uptrend intact)
✅ Volume structure confirmation (positive delta divergences)
✅ Technical indicator confluence (4+ bullish signals)
✅ Institutional footprint patterns (absorption visible)
✅ Risk/reward extremely favorable (1:4.08)
✅ Stop placed below critical support structure
The convergence of footprint intelligence, traditional technical analysis, and exceptional risk/reward creates an institutional-grade opportunity. The 4.08:1 reward-to-risk ratio means even with a 25% win rate, this strategy remains profitable long-term.
⚠️ Disclaimer: This analysis represents technical observations only. Always conduct your own due diligence and manage position size according to your risk tolerance.
PepsiCo has demonstrated a robust uptrend architecture spanning May through September, establishing a clear sequence of higher highs and higher lows. The current retracement presents a textbook opportunity as price revisits a proven demand zone where institutional buyers previously stepped in with conviction.
The numbered wave structure reveals critical market psychology:
- Point 1 → 3: Breakout confirmation with close above initial resistance
- Point 2: Established as verified institutional accumulation zone
- Point 3 → 4: Natural retracement returning to test proven buyers
### Volume Footprint Intelligence
The granular footprint analysis exposes sophisticated accumulation patterns invisible on traditional charts:
Monday Sept 8: Despite aggressive selling with multiple imbalances, price rejected and closed above a buying imbalance zone. The positive delta on a bearish bar signals hidden institutional absorption of retail selling.
Tuesday Sept 9: Three stacked bullish imbalances formed while price pushed lower—classic absorption pattern. Negative delta divergence confirms smart money accumulating into weakness.
Wednesday Sept 10: Clean bullish close above imbalance with supporting positive delta—accumulation phase transitioning to markup.
Thursday Sept 11: Price conquered the value area high/low of previous three sessions with dual bullish imbalances and positive delta confirmation.
### Multi-Timeframe Oscillator Divergences
The technical mosaic presents compelling bullish divergences across multiple indicators:
- RSI & MFI: Both oscillators display oversold conditions at Point 4 while price forms a higher high versus Point 2—textbook positive divergence
- OBV: Piercing the lower Bollinger Band deviation signals exhausted selling pressure
- CDV: Price returned to pre-discovery consolidation zone—historically a high-probability reversal area
### Anchored VWAP Confluence
The anchored VWAP from the momentum initiation point provides dynamic support precisely at Points 2 and 4, confirming this level as algorithmically significant for institutional participants.
### Risk Management Framework
Entry Zone: $143.53 (current market price)
Stop Loss: $141.00 (-4.47% from entry | Risk: $750 per contract)
Take Profit: $168.25 (+18.25% from entry | Reward: $2,616 per contract)
Risk/Reward Ratio: 1:4.08 — exceptional asymmetric opportunity
Position Sizing: With a 4.08:1 reward-to-risk ratio, this setup offers substantial upside with controlled downside. Size position according to account risk tolerance (1-2% max risk recommended).
### Trade Execution Strategy
Entry Tactics:
- Primary entry at current levels ~$143.53
- Scale-in opportunity on any dip toward $142.50
- Confirmation entry on break above $144.50
Exit Strategy:
- Initial Target: $150.00 (psychological level) — consider taking 25% profits
- Secondary Target: $157.00 (halfway point) — reduce another 25%
- Final Target: $168.25 — exit remaining position or trail stop for continuation
Stop Management:
- Initial stop at $141.00 (below Point 2 support)
- Trail to breakeven once price reaches $150.00
- Trail to $145.00 when price hits $157.00
### Probability Assessment
This setup combines multiple high-conviction factors:
✅ Trend alignment (5-month uptrend intact)
✅ Volume structure confirmation (positive delta divergences)
✅ Technical indicator confluence (4+ bullish signals)
✅ Institutional footprint patterns (absorption visible)
✅ Risk/reward extremely favorable (1:4.08)
✅ Stop placed below critical support structure
The convergence of footprint intelligence, traditional technical analysis, and exceptional risk/reward creates an institutional-grade opportunity. The 4.08:1 reward-to-risk ratio means even with a 25% win rate, this strategy remains profitable long-term.
⚠️ Disclaimer: This analysis represents technical observations only. Always conduct your own due diligence and manage position size according to your risk tolerance.
for trading mentorship and community, message me on telegram : jacesabr_real
คำจำกัดสิทธิ์ความรับผิดชอบ
ข้อมูลและบทความไม่ได้มีวัตถุประสงค์เพื่อก่อให้เกิดกิจกรรมทางการเงิน, การลงทุน, การซื้อขาย, ข้อเสนอแนะ หรือคำแนะนำประเภทอื่น ๆ ที่ให้หรือรับรองโดย TradingView อ่านเพิ่มเติมที่ ข้อกำหนดการใช้งาน
for trading mentorship and community, message me on telegram : jacesabr_real
คำจำกัดสิทธิ์ความรับผิดชอบ
ข้อมูลและบทความไม่ได้มีวัตถุประสงค์เพื่อก่อให้เกิดกิจกรรมทางการเงิน, การลงทุน, การซื้อขาย, ข้อเสนอแนะ หรือคำแนะนำประเภทอื่น ๆ ที่ให้หรือรับรองโดย TradingView อ่านเพิ่มเติมที่ ข้อกำหนดการใช้งาน