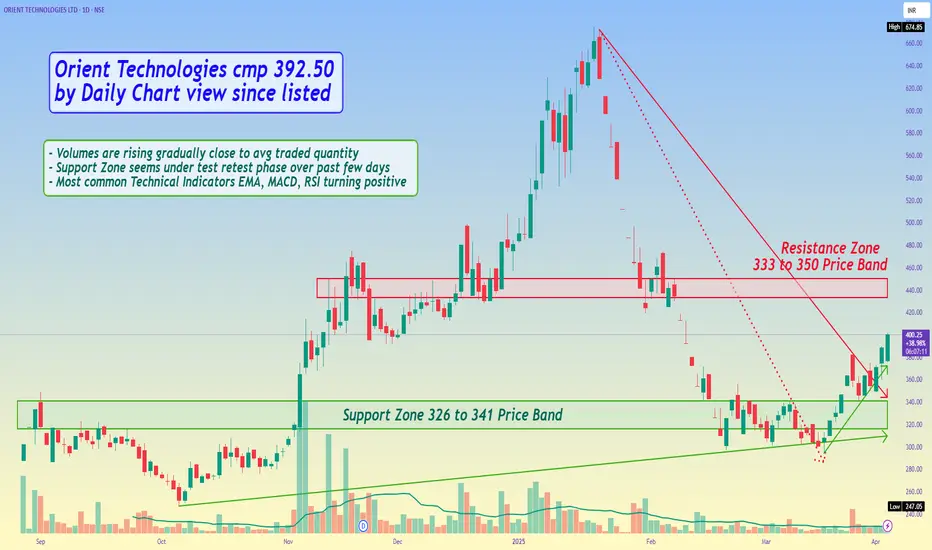
Orient Technologies cmp 392.50 by Daily Chart view since listed
- Support Zone 326 to 341 Price Band
- Resistance Zone 333 to 350 Price Band
- Volumes are rising gradually close to avg traded quantity
- Support Zone seems under test retest phase over past few days
- Most common Technical Indicators EMA, MACD, RSI turning positive
- Price sustaining above Falling Resistance Trendline and Rising Support Trendline
บันทึก
Ooops My Bad.... Please read the Resistance Zone as 433 to 450 Price Band คำจำกัดสิทธิ์ความรับผิดชอบ
ข้อมูลและบทความไม่ได้มีวัตถุประสงค์เพื่อก่อให้เกิดกิจกรรมทางการเงิน, การลงทุน, การซื้อขาย, ข้อเสนอแนะ หรือคำแนะนำประเภทอื่น ๆ ที่ให้หรือรับรองโดย TradingView อ่านเพิ่มเติมใน ข้อกำหนดการใช้งาน
คำจำกัดสิทธิ์ความรับผิดชอบ
ข้อมูลและบทความไม่ได้มีวัตถุประสงค์เพื่อก่อให้เกิดกิจกรรมทางการเงิน, การลงทุน, การซื้อขาย, ข้อเสนอแนะ หรือคำแนะนำประเภทอื่น ๆ ที่ให้หรือรับรองโดย TradingView อ่านเพิ่มเติมใน ข้อกำหนดการใช้งาน