After reviewing  OMC, inspired by an excellent idea posted by TopChartPatterns titled “A 10% rally is about to happen in OMC,” I decided to take a closer look at this potential investment.
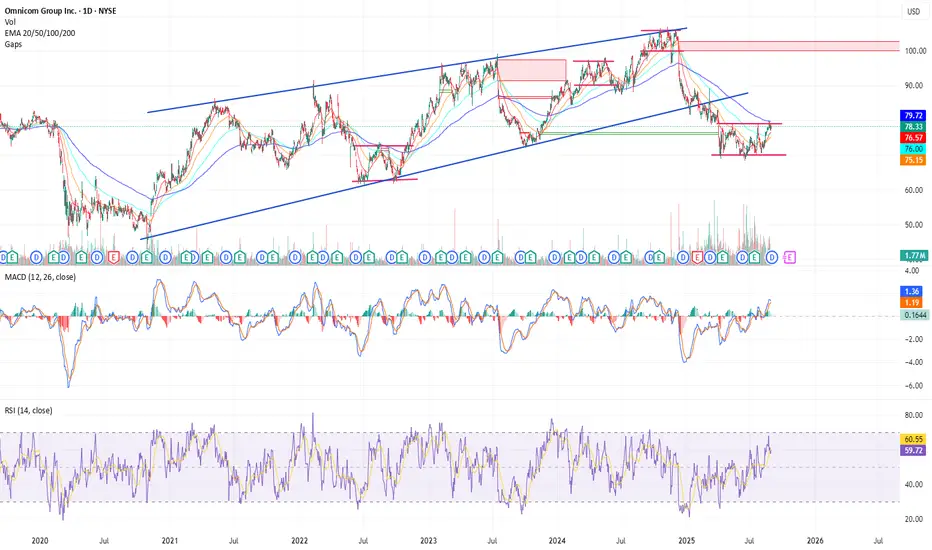
On the short-term chart,OMC is currently in a consolidation phase, forming a rectangle pattern with well-defined support and resistance levels. Key indicators, such as the MACD and a healthy RSI around 60, point toward bullish momentum. The price is trading above the 20, 50, and 100 EMAs and is now approaching the 200 EMA. In my view, a decisive breakout above the 200 EMA would serve as a strong bullish confirmation, potentially triggering a rally toward the blue resistance line and re-entering the long-standing rising wedge channel. That channel, which lasted for several years, demonstrated significant strength but was broken in February 2025 as bullish momentum across the waves visibly weakened.
In summary: with sufficient volume, a clean breakout above the $79 resistance could spark momentum buying, making the old wedge resistance line the next logical target for a retest.
On the short-term chart,
In summary: with sufficient volume, a clean breakout above the $79 resistance could spark momentum buying, making the old wedge resistance line the next logical target for a retest.
การซื้อขายยังคงดำเนินอยู่
The stock has just completed a 5-wave Elliott count, and I expect it could pull back toward the $75 zone before starting a new impulse and breaking above resistanceการนำเสนอที่เกี่ยวข้อง
คำจำกัดสิทธิ์ความรับผิดชอบ
ข้อมูลและบทความไม่ได้มีวัตถุประสงค์เพื่อก่อให้เกิดกิจกรรมทางการเงิน, การลงทุน, การซื้อขาย, ข้อเสนอแนะ หรือคำแนะนำประเภทอื่น ๆ ที่ให้หรือรับรองโดย TradingView อ่านเพิ่มเติมที่ ข้อกำหนดการใช้งาน
การนำเสนอที่เกี่ยวข้อง
คำจำกัดสิทธิ์ความรับผิดชอบ
ข้อมูลและบทความไม่ได้มีวัตถุประสงค์เพื่อก่อให้เกิดกิจกรรมทางการเงิน, การลงทุน, การซื้อขาย, ข้อเสนอแนะ หรือคำแนะนำประเภทอื่น ๆ ที่ให้หรือรับรองโดย TradingView อ่านเพิ่มเติมที่ ข้อกำหนดการใช้งาน