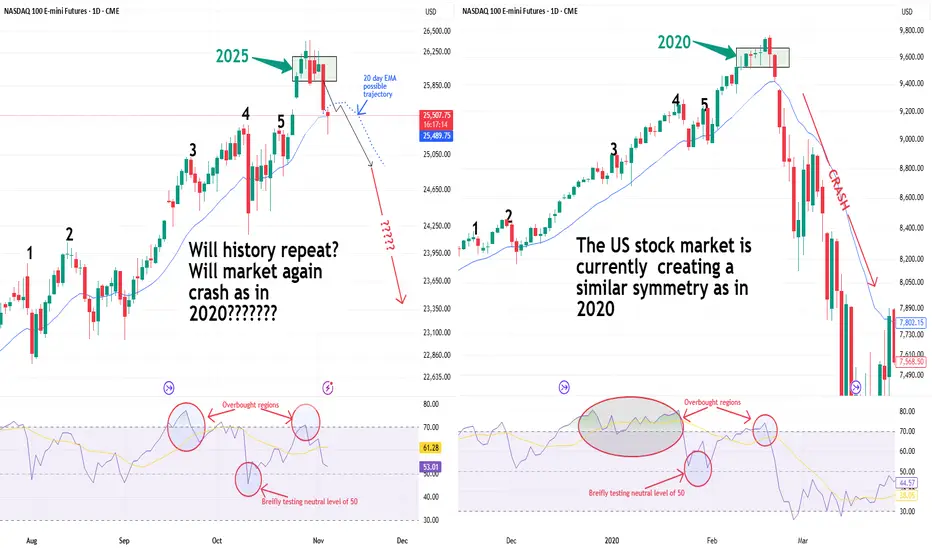
The NASDAQ 100 is creating a similar price action symmetry and RSI behavior to the pattern seen just before the 2020 crash.
* In 2020, this setup led to a sharp correction.
* In 2025, the symmetry looks almost identical.
Is it déjà vu — or just another pause before the next leg up?
* In 2020, this setup led to a sharp correction.
* In 2025, the symmetry looks almost identical.
Is it déjà vu — or just another pause before the next leg up?
Certified Market Technician
WA: +33755531401 +971545965565
marketinvestopedia.com/
WA: +33755531401 +971545965565
marketinvestopedia.com/
คำจำกัดสิทธิ์ความรับผิดชอบ
ข้อมูลและบทความไม่ได้มีวัตถุประสงค์เพื่อก่อให้เกิดกิจกรรมทางการเงิน, การลงทุน, การซื้อขาย, ข้อเสนอแนะ หรือคำแนะนำประเภทอื่น ๆ ที่ให้หรือรับรองโดย TradingView อ่านเพิ่มเติมที่ ข้อกำหนดการใช้งาน