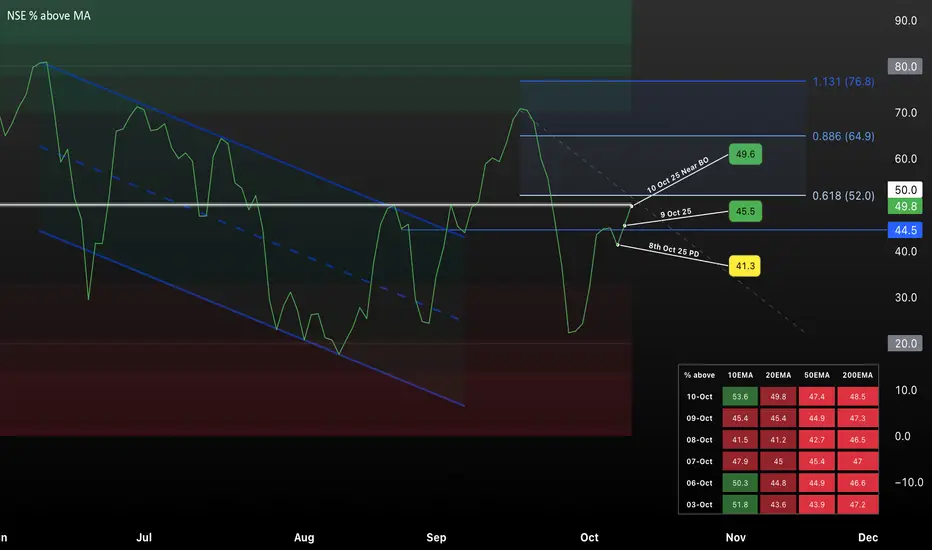
This TradingView chart visualizes the percentage of NSE stocks trading above key moving averages (10EMA, 20EMA, 50EMA, 200EMA) over recent months, highlighting a potential breakout zone as of October 2025. Key price levels (41.3, 44.5, 45.5, 49.6) are marked, with Fibonacci retracement zones indicating possible resistance and support. The chart showcases prior downtrend, recent recovery, and stalled momentum around the 50 level, making it a useful reference for market breadth and trend strength analysis for short-term trading strategies.
คำจำกัดสิทธิ์ความรับผิดชอบ
ข้อมูลและบทความไม่ได้มีวัตถุประสงค์เพื่อก่อให้เกิดกิจกรรมทางการเงิน, การลงทุน, การซื้อขาย, ข้อเสนอแนะ หรือคำแนะนำประเภทอื่น ๆ ที่ให้หรือรับรองโดย TradingView อ่านเพิ่มเติมใน ข้อกำหนดการใช้งาน
คำจำกัดสิทธิ์ความรับผิดชอบ
ข้อมูลและบทความไม่ได้มีวัตถุประสงค์เพื่อก่อให้เกิดกิจกรรมทางการเงิน, การลงทุน, การซื้อขาย, ข้อเสนอแนะ หรือคำแนะนำประเภทอื่น ๆ ที่ให้หรือรับรองโดย TradingView อ่านเพิ่มเติมใน ข้อกำหนดการใช้งาน