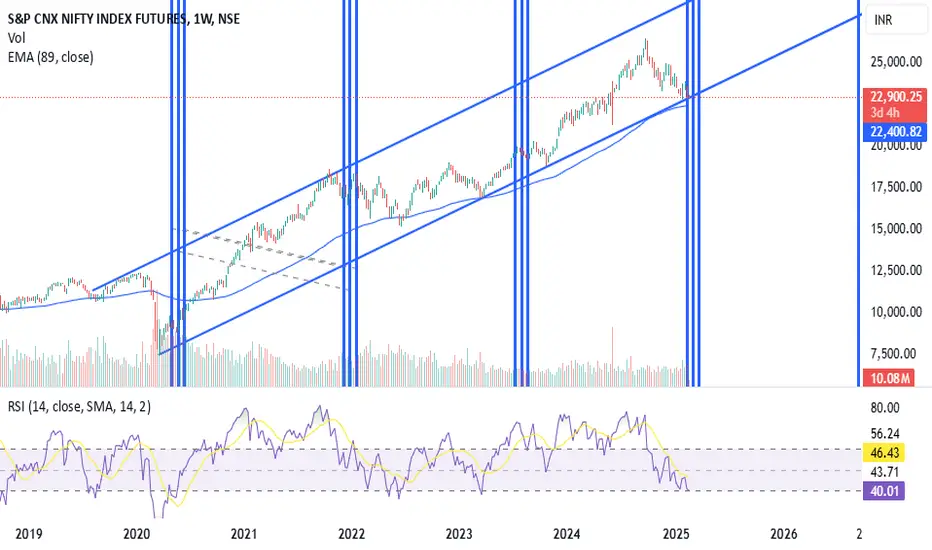
As seen on weekly charts of nifty it has entered a time-cycle zone and multiple supports are in this zone. A trend-line on weekly chart, Weekly moving average, monthly mid of bollinger band or 20 SMA and a bullish time-cycle zone all these supports are in the range of 22200-22800.
A close above a previous day high will show 1st signs of reversal and close above weekly high will confirm the reversal.
Investing partially will be recommended at current levels.
A close above a previous day high will show 1st signs of reversal and close above weekly high will confirm the reversal.
Investing partially will be recommended at current levels.
คำจำกัดสิทธิ์ความรับผิดชอบ
ข้อมูลและบทความไม่ได้มีวัตถุประสงค์เพื่อก่อให้เกิดกิจกรรมทางการเงิน, การลงทุน, การซื้อขาย, ข้อเสนอแนะ หรือคำแนะนำประเภทอื่น ๆ ที่ให้หรือรับรองโดย TradingView อ่านเพิ่มเติมที่ ข้อกำหนดการใช้งาน
คำจำกัดสิทธิ์ความรับผิดชอบ
ข้อมูลและบทความไม่ได้มีวัตถุประสงค์เพื่อก่อให้เกิดกิจกรรมทางการเงิน, การลงทุน, การซื้อขาย, ข้อเสนอแนะ หรือคำแนะนำประเภทอื่น ๆ ที่ให้หรือรับรองโดย TradingView อ่านเพิ่มเติมที่ ข้อกำหนดการใช้งาน