🔎 Market Structure Analysis (Nifty 50)
🔹 4H Chart (Swing Bias)
Nifty has been recovering inside an ascending channel after the recent downtrend.
Price is hovering around 24,700 resistance, which aligns with a supply/FVG zone.
Multiple rejections seen in this zone → shows sellers are active.
Support zone: 24,580–24,600 (channel base + previous FVG).
Overall: Market is trying to shift from bearish to neutral → but facing overhead supply.
Bias: Neutral-to-bullish as long as 24,580 holds. A break below opens 24,320 demand.
🔹 1H Chart (Intraday Bias)
Price is respecting the rising channel structure.
EMA is turning upward, but rejection near 24,740–24,760 supply zone.
Clean FVG gap support around 24,640–24,660.
If price sustains above 24,660 → can push toward 24,800–24,850 resistance.
Below 24,600 → structure weakens, pullback likely.
Bias: Intraday bullish above 24,660 | Bearish below 24,600.
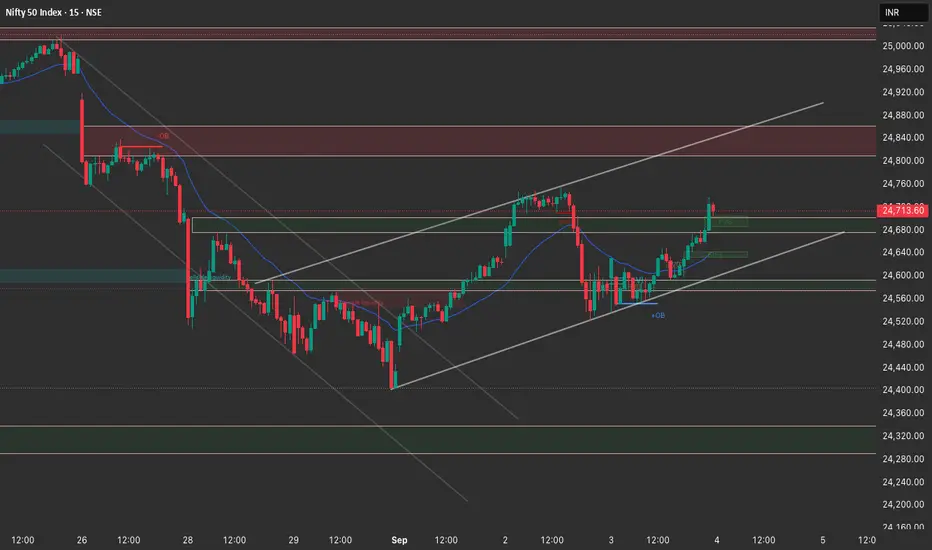
🔹 15M Chart (Execution View)
Clear rejection from supply near 24,740–24,760.
Demand zones marked at 24,640–24,660 (short-term OB + FVG).
Another strong demand at 24,560–24,580.
If demand holds, scalps to the upside remain valid.
Break below 24,560 → triggers downside momentum.
📌 Trade Plan for 4th September (Nifty Futures/Options)
🔺 Long Setup (Bullish Bias)
Entry: Above 24,660 on 15m confirmation (green candle close).
Target 1: 24,740
Target 2: 24,800–24,850 (major supply).
SL: Below 24,600.
Rationale: Riding channel structure with EMA support.
🔻 Short Setup (Bearish Bias)
Entry: On rejection from 24,740–24,760 OR breakdown below 24,600.
Target 1: 24,560
Target 2: 24,480
Target 3: 24,320 (if heavy selling persists).
SL: Above 24,770 (for rejection short) or above 24,640 (for breakdown short).
Rationale: Supply rejection and failed channel hold.
🎯 Key Levels to Watch
Resistance Zones: 24,740–24,760 | 24,800–24,850
Support Zones: 24,640–24,660 | 24,560–24,580 | 24,320
👉 In short:
Bias is neutral-to-bullish intraday, but risk of pullback if 24,600 breaks.
Preferred Plan: Longs above 24,660 toward 24,800. Shorts only if supply holds or 24,600 breaks.
🔹 4H Chart (Swing Bias)
Nifty has been recovering inside an ascending channel after the recent downtrend.
Price is hovering around 24,700 resistance, which aligns with a supply/FVG zone.
Multiple rejections seen in this zone → shows sellers are active.
Support zone: 24,580–24,600 (channel base + previous FVG).
Overall: Market is trying to shift from bearish to neutral → but facing overhead supply.
Bias: Neutral-to-bullish as long as 24,580 holds. A break below opens 24,320 demand.
🔹 1H Chart (Intraday Bias)
Price is respecting the rising channel structure.
EMA is turning upward, but rejection near 24,740–24,760 supply zone.
Clean FVG gap support around 24,640–24,660.
If price sustains above 24,660 → can push toward 24,800–24,850 resistance.
Below 24,600 → structure weakens, pullback likely.
Bias: Intraday bullish above 24,660 | Bearish below 24,600.
🔹 15M Chart (Execution View)
Clear rejection from supply near 24,740–24,760.
Demand zones marked at 24,640–24,660 (short-term OB + FVG).
Another strong demand at 24,560–24,580.
If demand holds, scalps to the upside remain valid.
Break below 24,560 → triggers downside momentum.
📌 Trade Plan for 4th September (Nifty Futures/Options)
🔺 Long Setup (Bullish Bias)
Entry: Above 24,660 on 15m confirmation (green candle close).
Target 1: 24,740
Target 2: 24,800–24,850 (major supply).
SL: Below 24,600.
Rationale: Riding channel structure with EMA support.
🔻 Short Setup (Bearish Bias)
Entry: On rejection from 24,740–24,760 OR breakdown below 24,600.
Target 1: 24,560
Target 2: 24,480
Target 3: 24,320 (if heavy selling persists).
SL: Above 24,770 (for rejection short) or above 24,640 (for breakdown short).
Rationale: Supply rejection and failed channel hold.
🎯 Key Levels to Watch
Resistance Zones: 24,740–24,760 | 24,800–24,850
Support Zones: 24,640–24,660 | 24,560–24,580 | 24,320
👉 In short:
Bias is neutral-to-bullish intraday, but risk of pullback if 24,600 breaks.
Preferred Plan: Longs above 24,660 toward 24,800. Shorts only if supply holds or 24,600 breaks.
คำจำกัดสิทธิ์ความรับผิดชอบ
ข้อมูลและบทความไม่ได้มีวัตถุประสงค์เพื่อก่อให้เกิดกิจกรรมทางการเงิน, การลงทุน, การซื้อขาย, ข้อเสนอแนะ หรือคำแนะนำประเภทอื่น ๆ ที่ให้หรือรับรองโดย TradingView อ่านเพิ่มเติมใน ข้อกำหนดการใช้งาน
คำจำกัดสิทธิ์ความรับผิดชอบ
ข้อมูลและบทความไม่ได้มีวัตถุประสงค์เพื่อก่อให้เกิดกิจกรรมทางการเงิน, การลงทุน, การซื้อขาย, ข้อเสนอแนะ หรือคำแนะนำประเภทอื่น ๆ ที่ให้หรือรับรองโดย TradingView อ่านเพิ่มเติมใน ข้อกำหนดการใช้งาน