📊 NIFTY TRADING PLAN – 29-Aug-2025
📌 Key Levels to Watch:
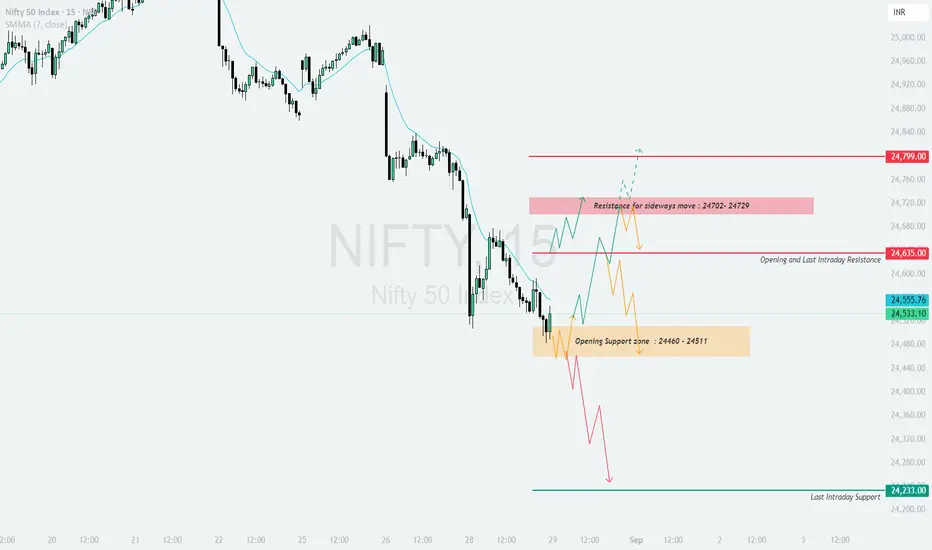
Opening & Last Intraday Resistance: 24,635
Resistance Zone for Sideways Move: 24,702 – 24,729
Major Resistance Above: 24,799
Opening Support Zone: 24,460 – 24,511
Last Intraday Support: 24,233
These levels highlight the battlefield where intraday buyers and sellers are likely to show their strength.
🔼 1. Gap-Up Opening (100+ points above 24,635)
If Nifty opens with a strong gap above 24,635, bullish momentum can extend.
📌 Plan of Action:
👉 Educational Note: On large gap-ups, avoid chasing momentum in the first 15 minutes. Wait for a pullback towards support for better risk-reward trades.
➖ 2. Flat Opening (Around 24,533 ± 50 points)
If Nifty opens flat near its current levels, the market will test supports and resistances for direction.
📌 Plan of Action:
👉 Educational Note: Flat openings often lead to choppy sessions. Patience is crucial—wait for clear candle closes around levels before making a move.
🔽 3. Gap-Down Opening (100+ points below 24,460)
If Nifty opens sharply below 24,460, sellers will maintain an upper hand.
📌 Plan of Action:
👉 Educational Note: Gap-downs often cause panic. Stick to your trading levels and avoid counter-trend entries unless there’s strong confirmation.
🛡️ Risk Management Tips for Options Traders
📌 Summary & Conclusion
🟢 Above 24,635 → Rally towards 24,702–24,729 → 24,799 possible.
🟧 Flat near 24,533 → Watch 24,511 (support) and 24,635 (resistance) for breakout.
🔴 Below 24,460 → Weakness towards 24,233 (critical support zone).
🎯 The tug-of-war lies between 24,460–24,635—whichever side breaks first will decide intraday trend.
⚠️ Disclaimer: I am not a SEBI-registered analyst. This trading plan is purely for educational purposes and should not be considered investment advice. Please do your own research or consult a financial advisor before trading.
📌 Key Levels to Watch:
Opening & Last Intraday Resistance: 24,635
Resistance Zone for Sideways Move: 24,702 – 24,729
Major Resistance Above: 24,799
Opening Support Zone: 24,460 – 24,511
Last Intraday Support: 24,233
These levels highlight the battlefield where intraday buyers and sellers are likely to show their strength.
🔼 1. Gap-Up Opening (100+ points above 24,635)
If Nifty opens with a strong gap above 24,635, bullish momentum can extend.
📌 Plan of Action:
- [] Sustaining above 24,702–24,729 (sideways resistance) can lift the index towards 24,799.
[] This zone is ideal for partial profit booking as supply pressure may emerge. - If the index fails to sustain above 24,702, expect sideways consolidation between 24,635–24,729 before any decisive move.
👉 Educational Note: On large gap-ups, avoid chasing momentum in the first 15 minutes. Wait for a pullback towards support for better risk-reward trades.
➖ 2. Flat Opening (Around 24,533 ± 50 points)
If Nifty opens flat near its current levels, the market will test supports and resistances for direction.
📌 Plan of Action:
- [] Holding above 24,511 will keep momentum intact for a test of 24,635.
[] A breakout above 24,635 may lead to a rally towards 24,702–24,729. - On the other hand, slipping below 24,460 may invite selling pressure, opening the path to 24,233.
👉 Educational Note: Flat openings often lead to choppy sessions. Patience is crucial—wait for clear candle closes around levels before making a move.
🔽 3. Gap-Down Opening (100+ points below 24,460)
If Nifty opens sharply below 24,460, sellers will maintain an upper hand.
📌 Plan of Action:
- [] Below 24,460, weakness can accelerate towards 24,233 (last intraday support).
[] Strong demand may emerge near 24,233; watch for long wicks or bullish reversal candles for intraday buying opportunities. - If 24,233 breaks decisively, the next phase of downside may trigger a deeper sell-off.
👉 Educational Note: Gap-downs often cause panic. Stick to your trading levels and avoid counter-trend entries unless there’s strong confirmation.
🛡️ Risk Management Tips for Options Traders
- [] Limit risk to 1–2% of capital per trade.
[] Use hourly close stop-losses for confirmation.
[] Consider spreads (Bull Call / Bear Put) to reduce time decay impact.
[] Book profits in parts—don’t wait for exact top or bottom. - Track India VIX closely, as volatility affects option premiums.
📌 Summary & Conclusion
🟢 Above 24,635 → Rally towards 24,702–24,729 → 24,799 possible.
🟧 Flat near 24,533 → Watch 24,511 (support) and 24,635 (resistance) for breakout.
🔴 Below 24,460 → Weakness towards 24,233 (critical support zone).
🎯 The tug-of-war lies between 24,460–24,635—whichever side breaks first will decide intraday trend.
⚠️ Disclaimer: I am not a SEBI-registered analyst. This trading plan is purely for educational purposes and should not be considered investment advice. Please do your own research or consult a financial advisor before trading.
คำจำกัดสิทธิ์ความรับผิดชอบ
ข้อมูลและบทความไม่ได้มีวัตถุประสงค์เพื่อก่อให้เกิดกิจกรรมทางการเงิน, การลงทุน, การซื้อขาย, ข้อเสนอแนะ หรือคำแนะนำประเภทอื่น ๆ ที่ให้หรือรับรองโดย TradingView อ่านเพิ่มเติมที่ ข้อกำหนดการใช้งาน
คำจำกัดสิทธิ์ความรับผิดชอบ
ข้อมูลและบทความไม่ได้มีวัตถุประสงค์เพื่อก่อให้เกิดกิจกรรมทางการเงิน, การลงทุน, การซื้อขาย, ข้อเสนอแนะ หรือคำแนะนำประเภทอื่น ๆ ที่ให้หรือรับรองโดย TradingView อ่านเพิ่มเติมที่ ข้อกำหนดการใช้งาน