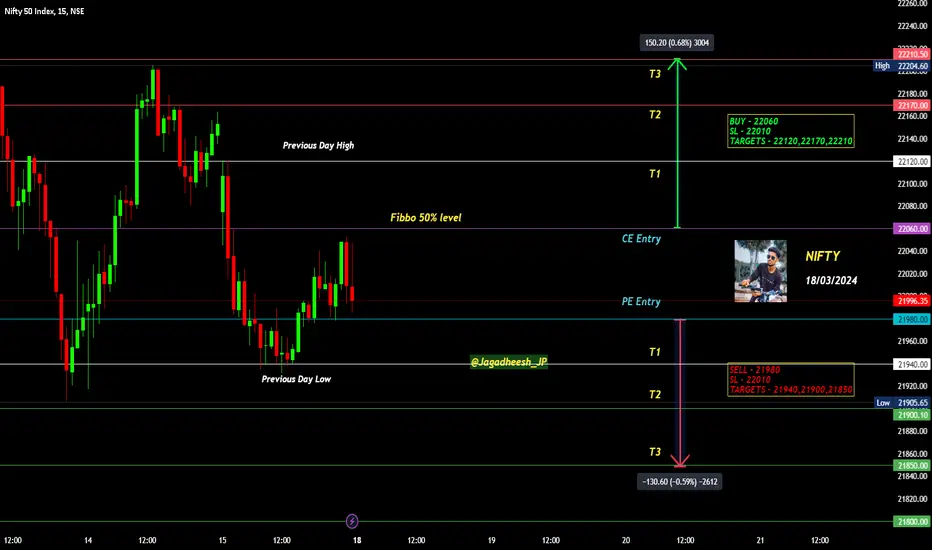
BUY ABOVE - 22060
SL - 22010
TARGETS - 22120,22170,22210
SELL BELOW - 21980
SL - 22010
TARGETS - 21940,21900,21850
NO TRADE ZONE - 21980 to 22060
Previous Day High - 22120
Previous Day Low - 21940
Based on price action major support & resistance's are here, the red lines acts as resistances, the green lines acts as supports. If the price breaks the support/resistance, it will move to the next support/resistance line. White lines indicates previous day high & low, high acts as a resistance & low acts as a support for next day.
Trendlines are also significant to price action. If the price is above/below the trendlines, can expect an UP/DOWN with aggressive move.
Please NOTE: this levels are for intraday trading only.
Disclaimer - All information on this page is for educational purposes only,
we are not SEBI Registered, Please consult a SEBI registered financial advisor for your financial matters before investing And taking any decision. We are not responsible for any profit/loss you made.
Request your support and engagement by liking and commenting & follow to provide encouragement
HAPPY TRADING 👍
SL - 22010
TARGETS - 22120,22170,22210
SELL BELOW - 21980
SL - 22010
TARGETS - 21940,21900,21850
NO TRADE ZONE - 21980 to 22060
Previous Day High - 22120
Previous Day Low - 21940
Based on price action major support & resistance's are here, the red lines acts as resistances, the green lines acts as supports. If the price breaks the support/resistance, it will move to the next support/resistance line. White lines indicates previous day high & low, high acts as a resistance & low acts as a support for next day.
Trendlines are also significant to price action. If the price is above/below the trendlines, can expect an UP/DOWN with aggressive move.
Please NOTE: this levels are for intraday trading only.
Disclaimer - All information on this page is for educational purposes only,
we are not SEBI Registered, Please consult a SEBI registered financial advisor for your financial matters before investing And taking any decision. We are not responsible for any profit/loss you made.
Request your support and engagement by liking and commenting & follow to provide encouragement
HAPPY TRADING 👍
บันทึก
-33.25(-0.15%) GAPDOWNการนำเสนอที่เกี่ยวข้อง
คำจำกัดสิทธิ์ความรับผิดชอบ
ข้อมูลและบทความไม่ได้มีวัตถุประสงค์เพื่อก่อให้เกิดกิจกรรมทางการเงิน, การลงทุน, การซื้อขาย, ข้อเสนอแนะ หรือคำแนะนำประเภทอื่น ๆ ที่ให้หรือรับรองโดย TradingView อ่านเพิ่มเติมใน ข้อกำหนดการใช้งาน
การนำเสนอที่เกี่ยวข้อง
คำจำกัดสิทธิ์ความรับผิดชอบ
ข้อมูลและบทความไม่ได้มีวัตถุประสงค์เพื่อก่อให้เกิดกิจกรรมทางการเงิน, การลงทุน, การซื้อขาย, ข้อเสนอแนะ หรือคำแนะนำประเภทอื่น ๆ ที่ให้หรือรับรองโดย TradingView อ่านเพิ่มเติมใน ข้อกำหนดการใช้งาน